Skip to collection list
Skip to video grid
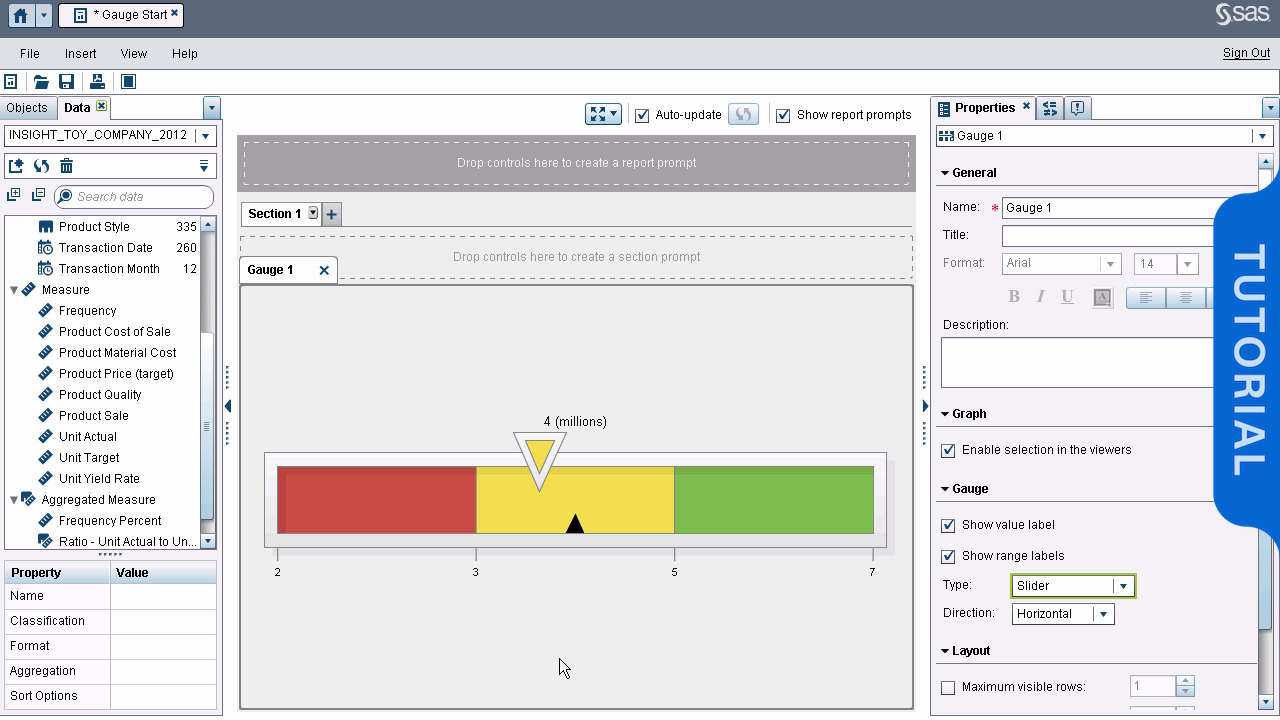
SAS Visual Analytics
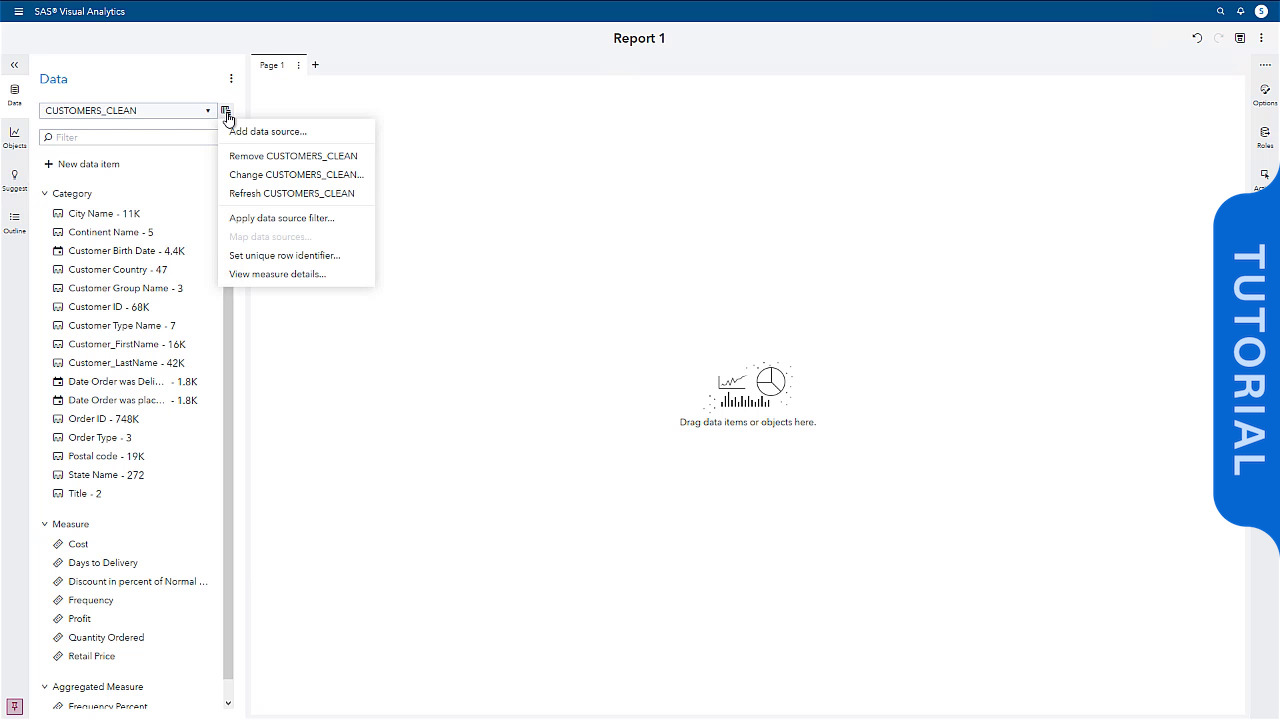
Explore and Visualize Data with SAS Visual Analytics
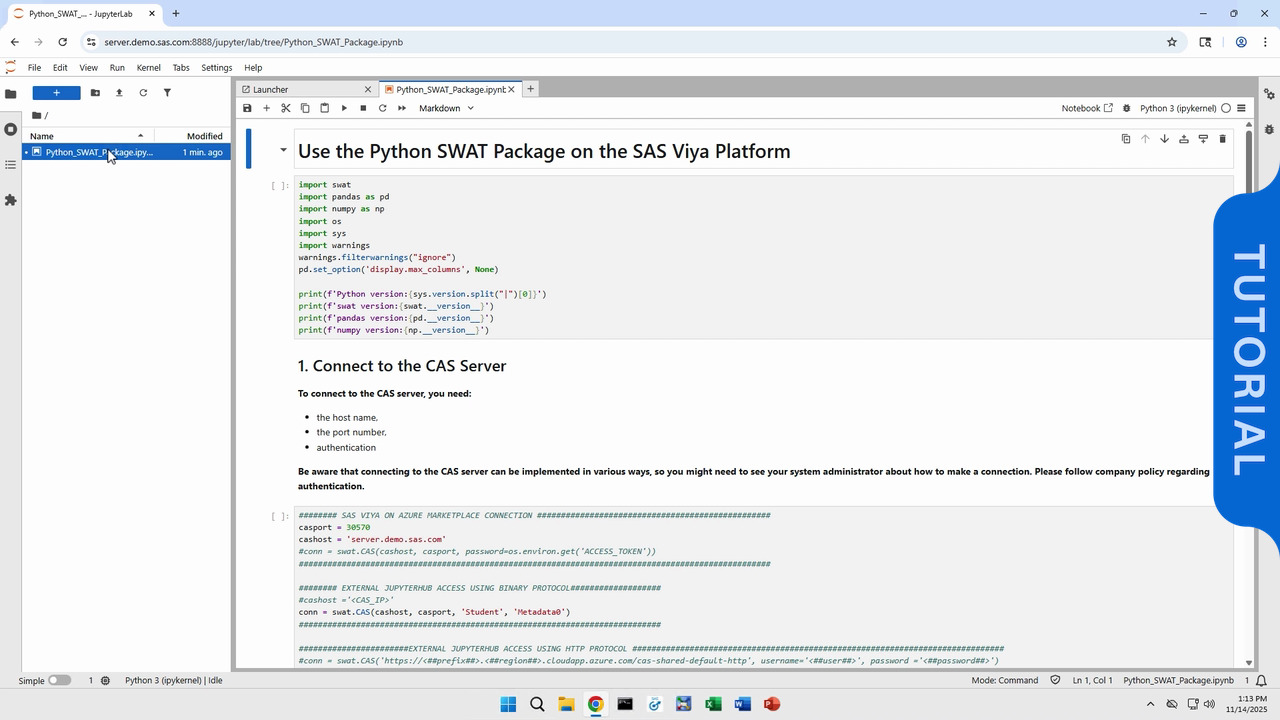
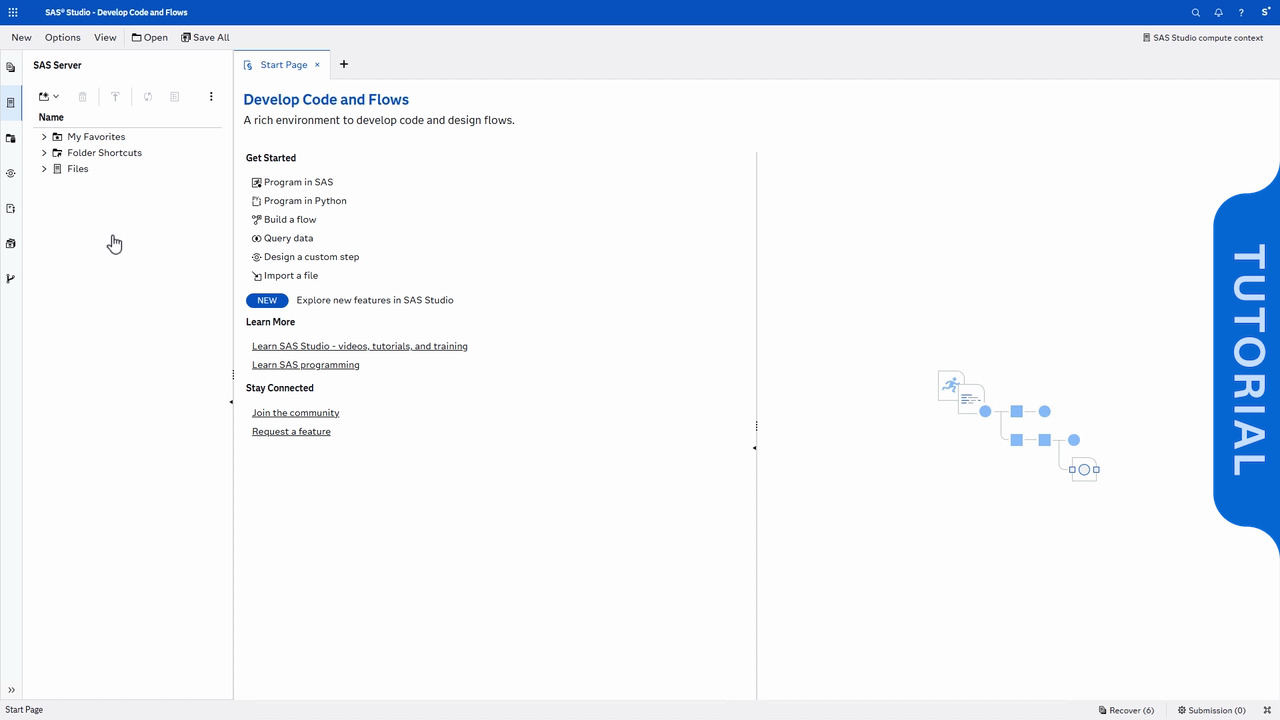
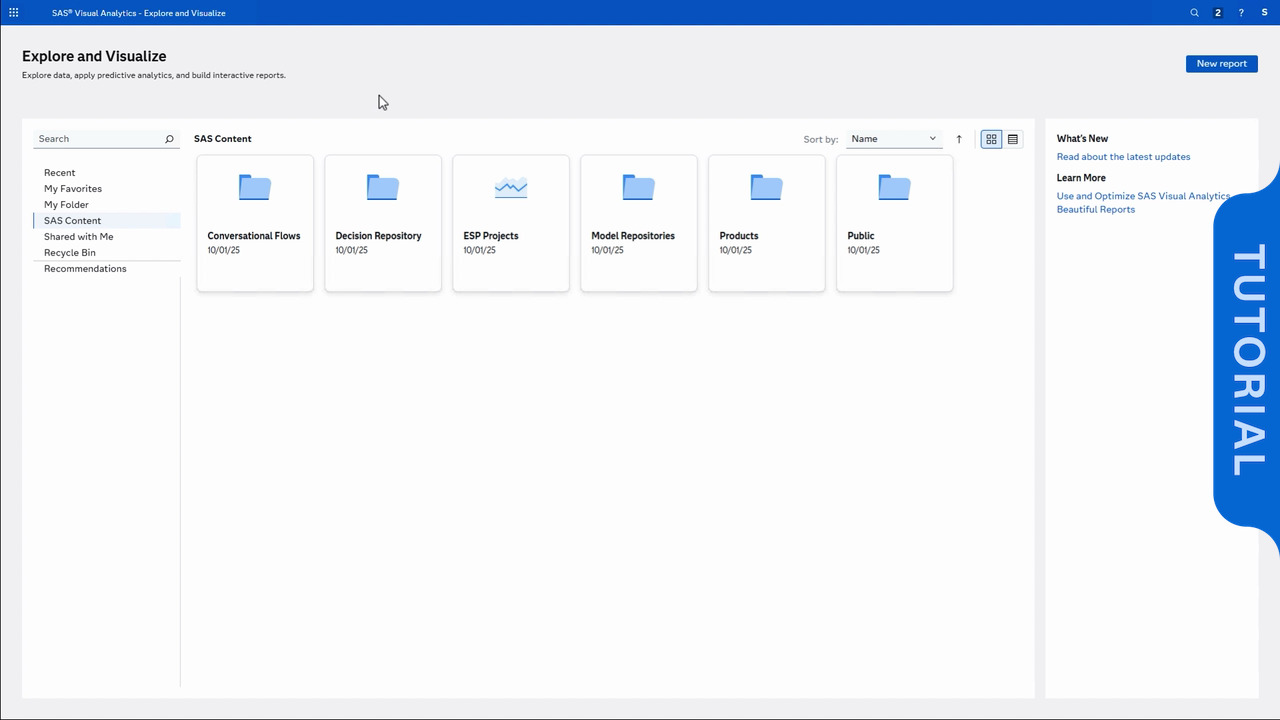
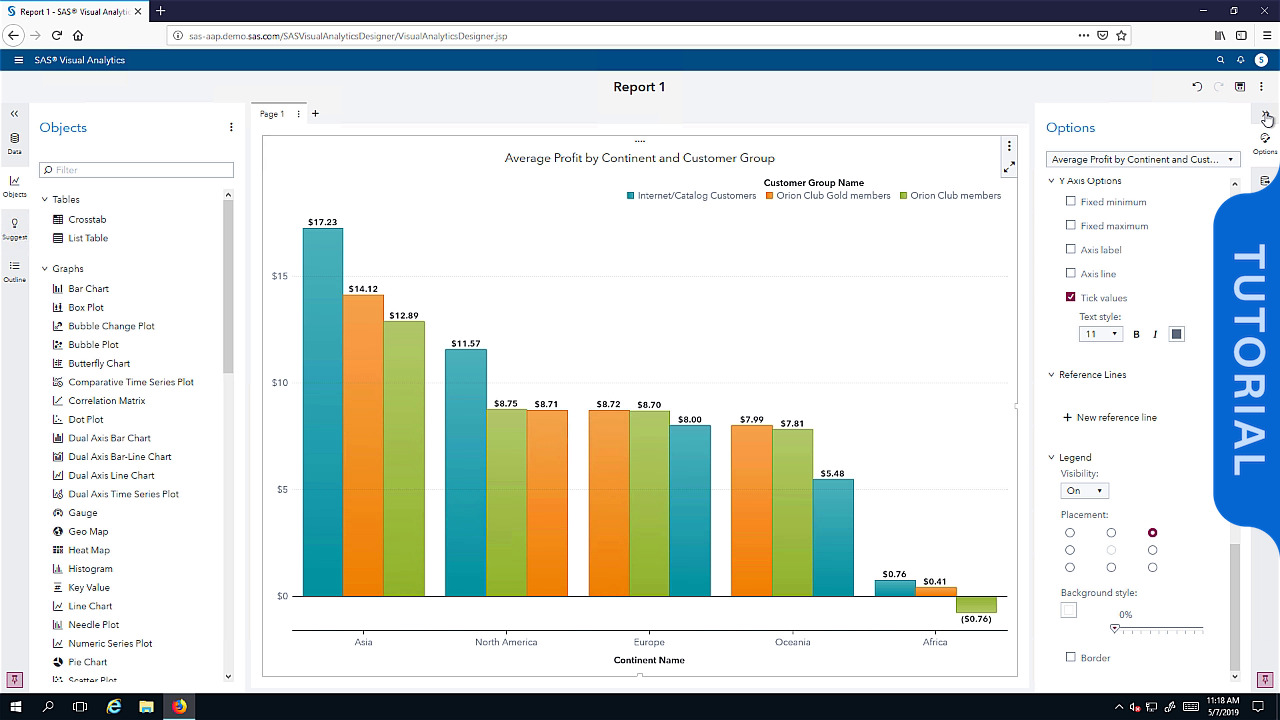
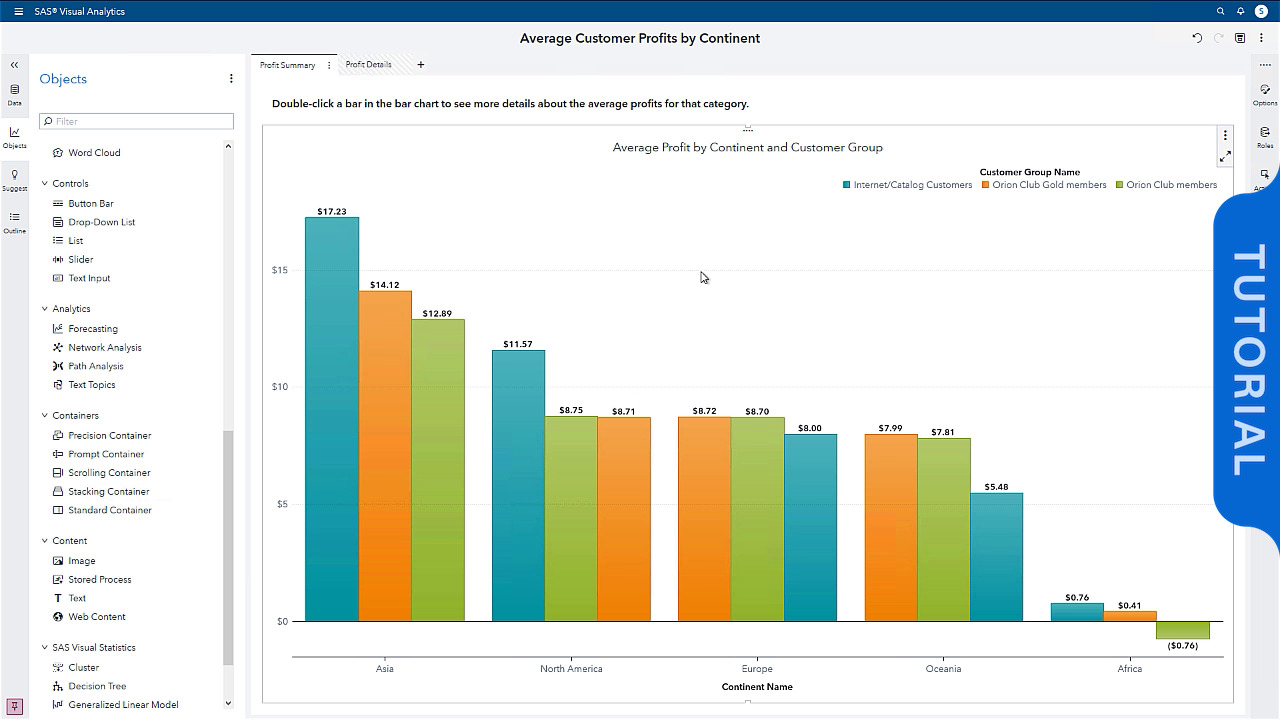
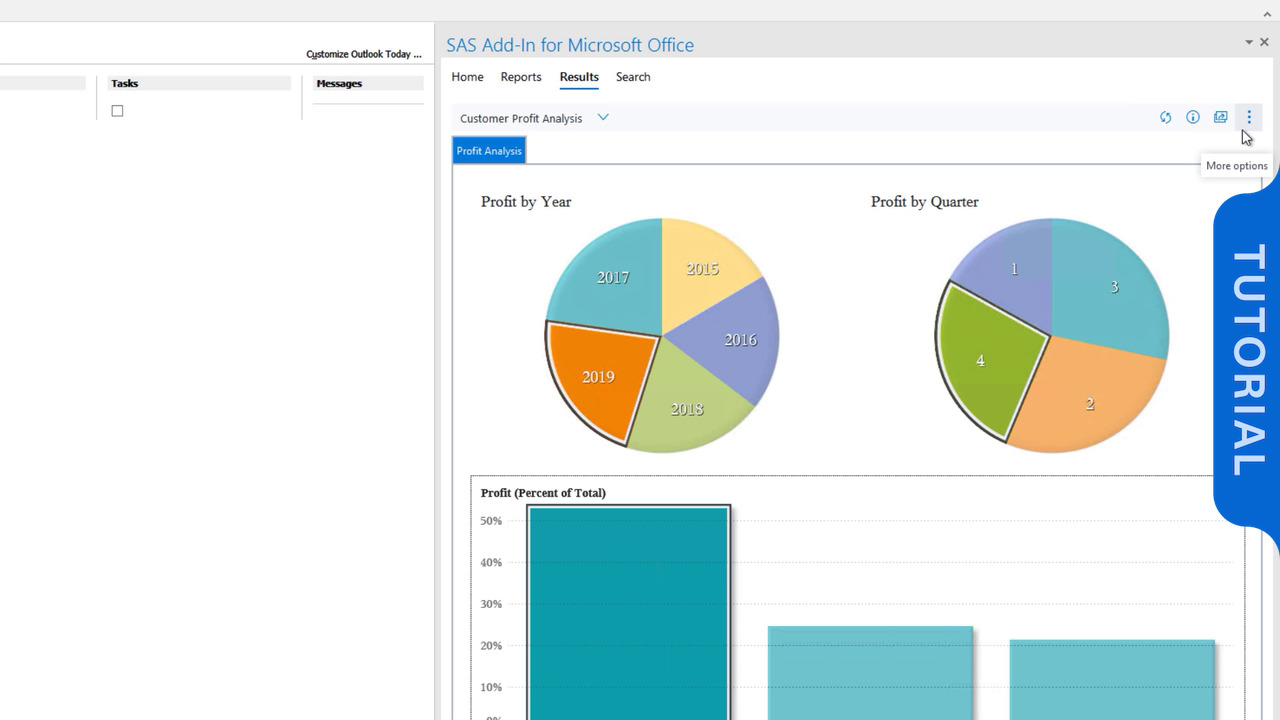
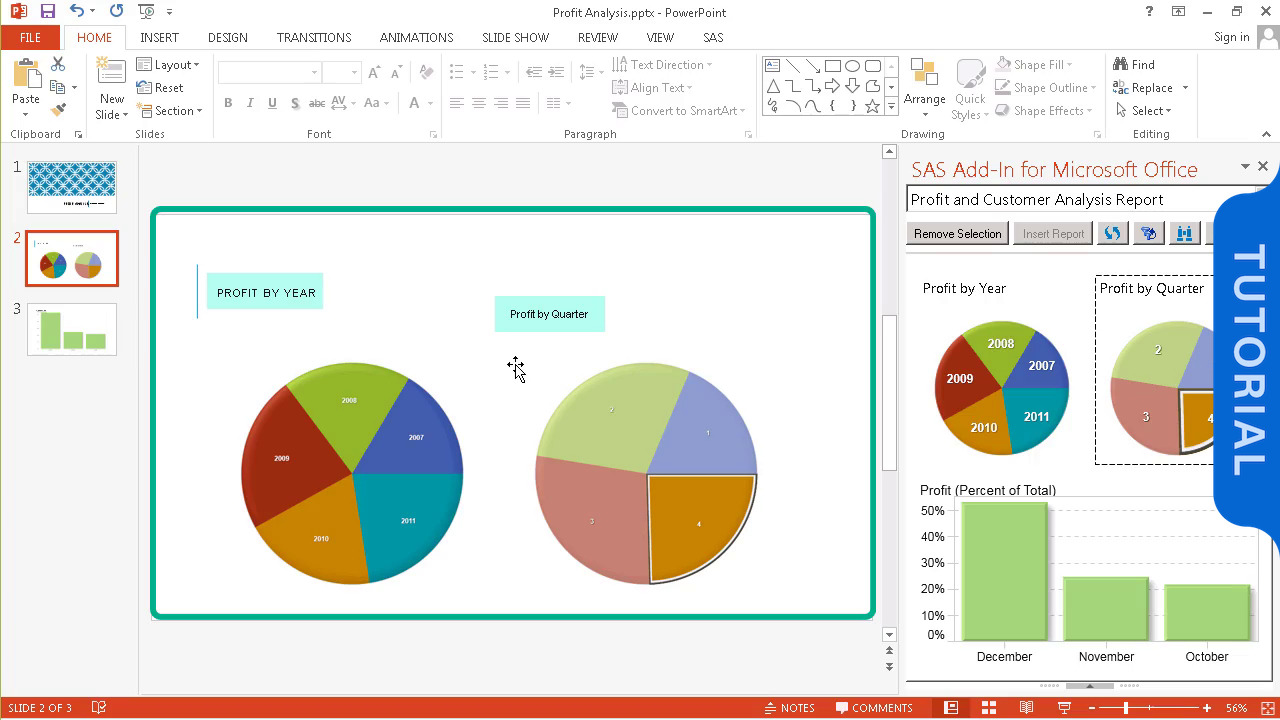
This Quick Start tutorial shows you how to explore and visualize data with SAS Visual Analytics. You learn how to access and prepare data, create interactive charts, reports, and maps to learn about your data, and build a preliminary predictive model
Read More
Read Less
categories
View more in
Currently loaded videos are 1 through 15 of 44 total videos.
First page loaded, no previous page available
Load Next Page
Sort By:
Sort By:
Most Recent