Skip to collection list
Skip to video grid
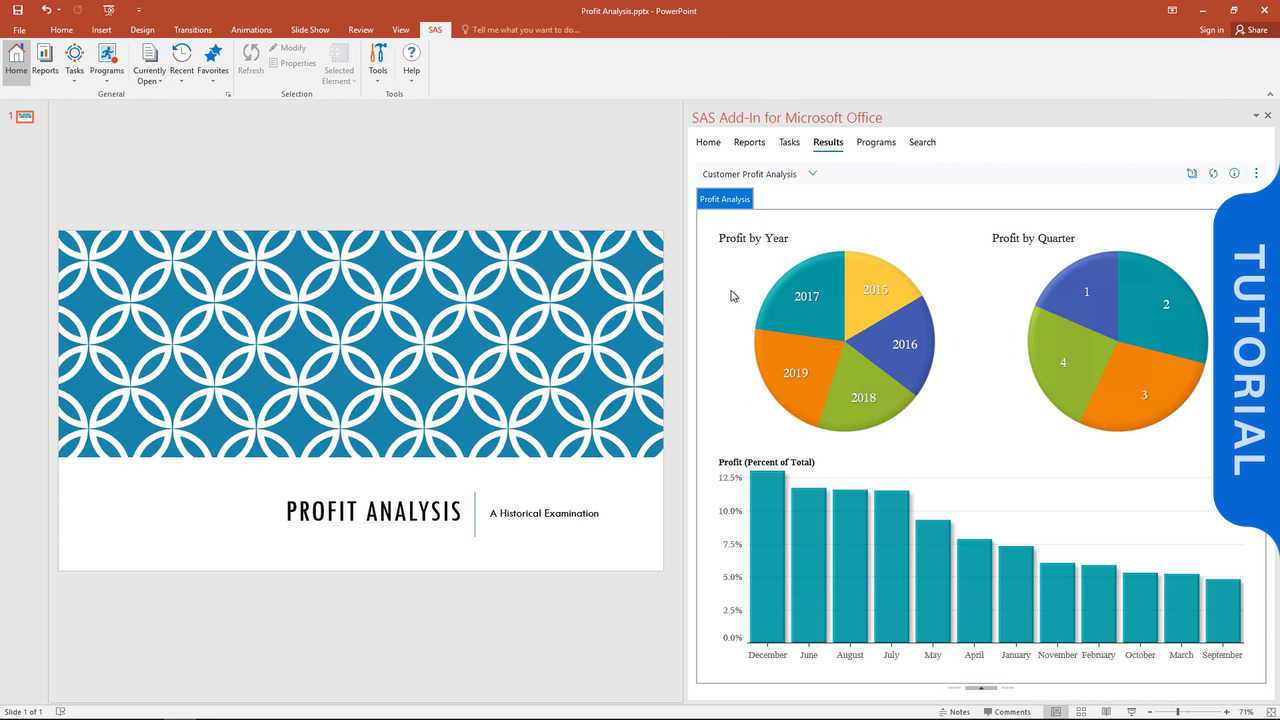
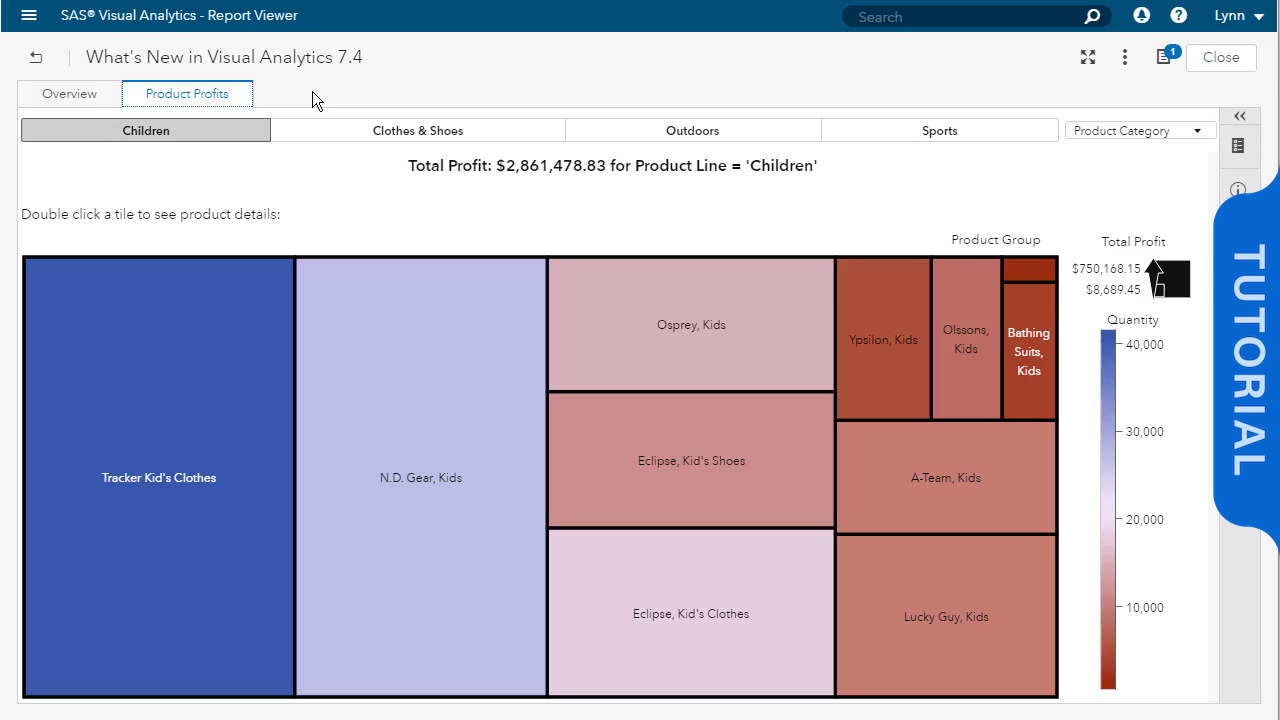
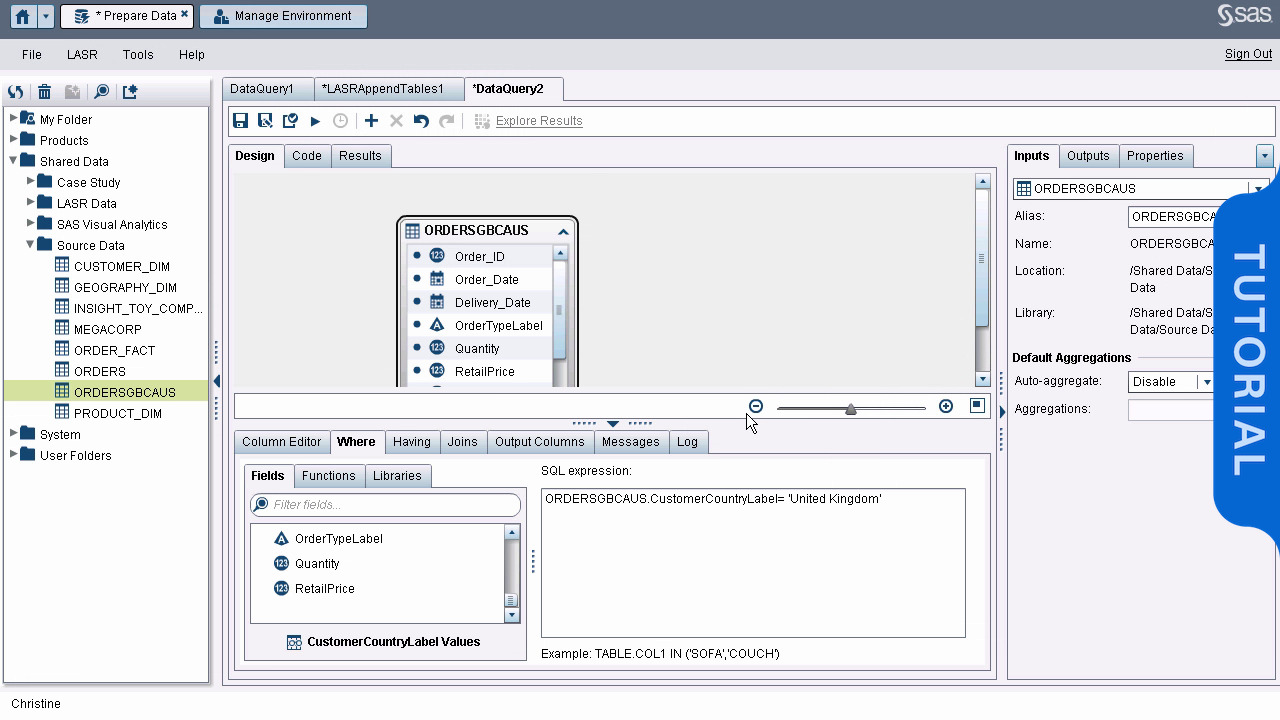
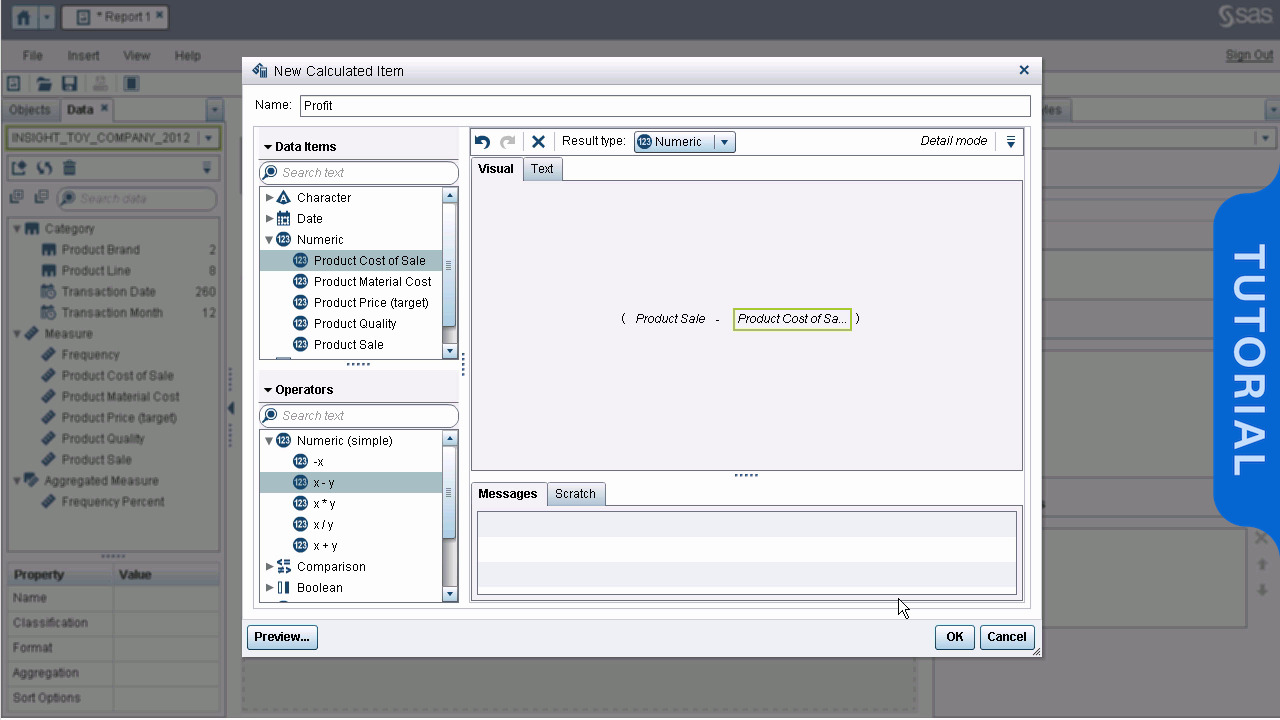
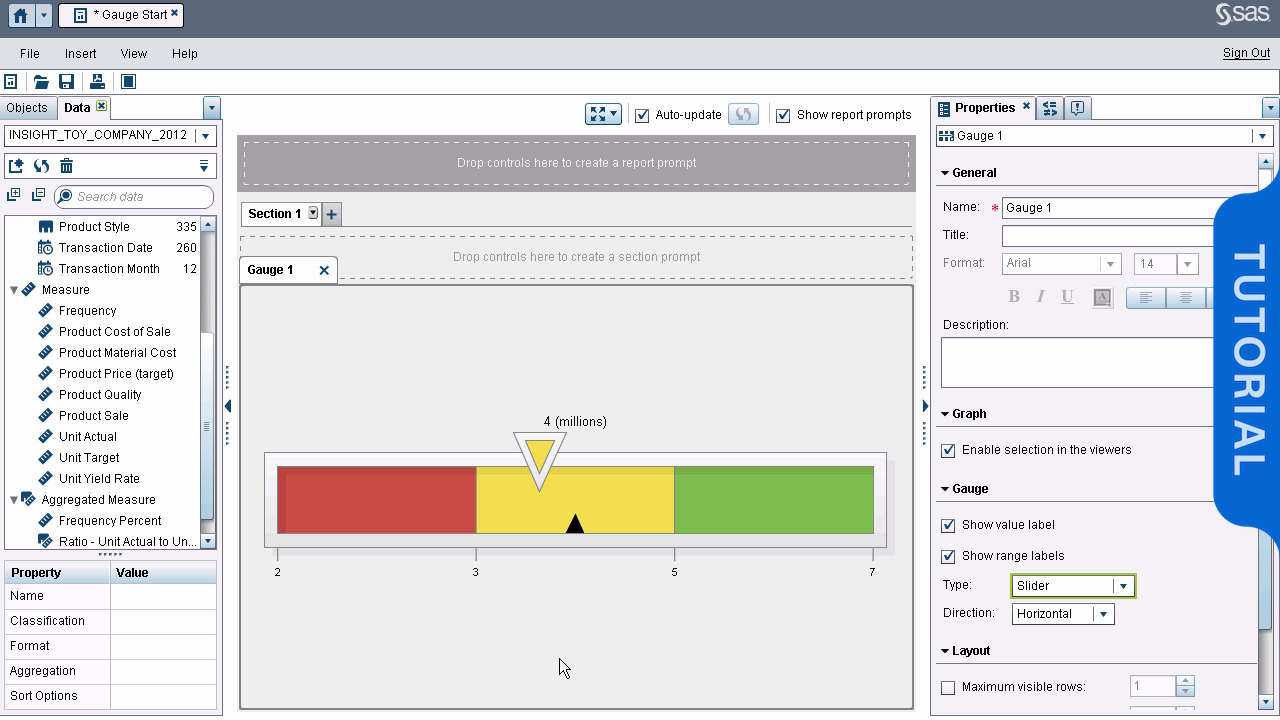
SAS Visual Analytics
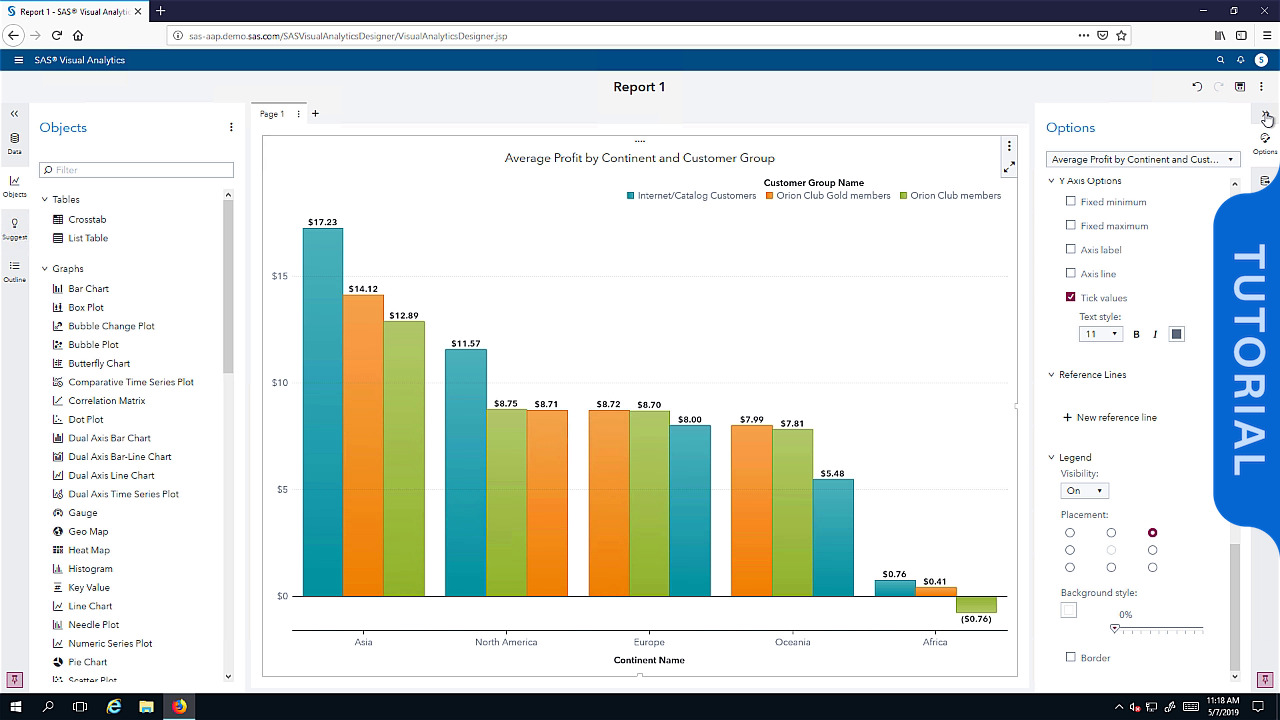
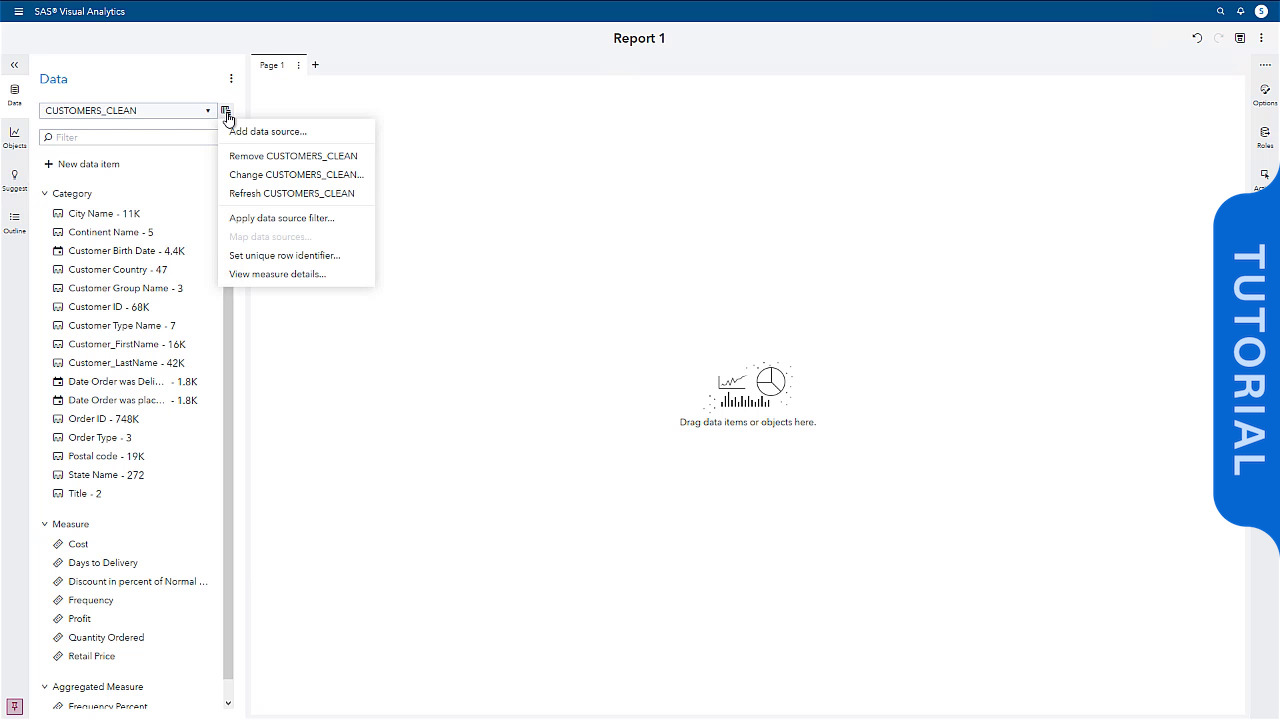
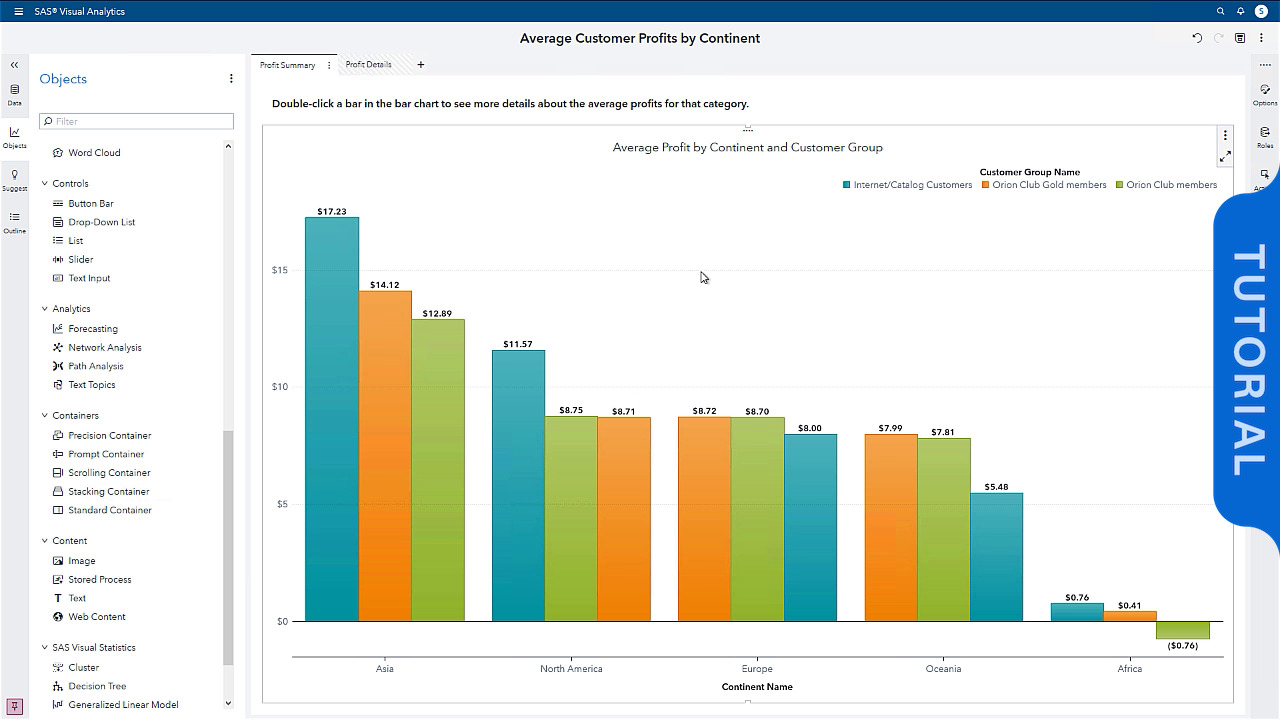
Working with Reports: Deriving New Data Items
This video covers deriving new calculated data items and a new aggregated measure. These new derived data items are used in a line chart and bar chart object in a report.
Read More
Read Less
categories
View more in
Currently loaded videos are 1 through 15 of 44 total videos.
First page loaded, no previous page available
Load Next Page
Sort By:
Sort By:
Most Recent