Video Player is loading.
Skip to collection list
Skip to video grid
Trending
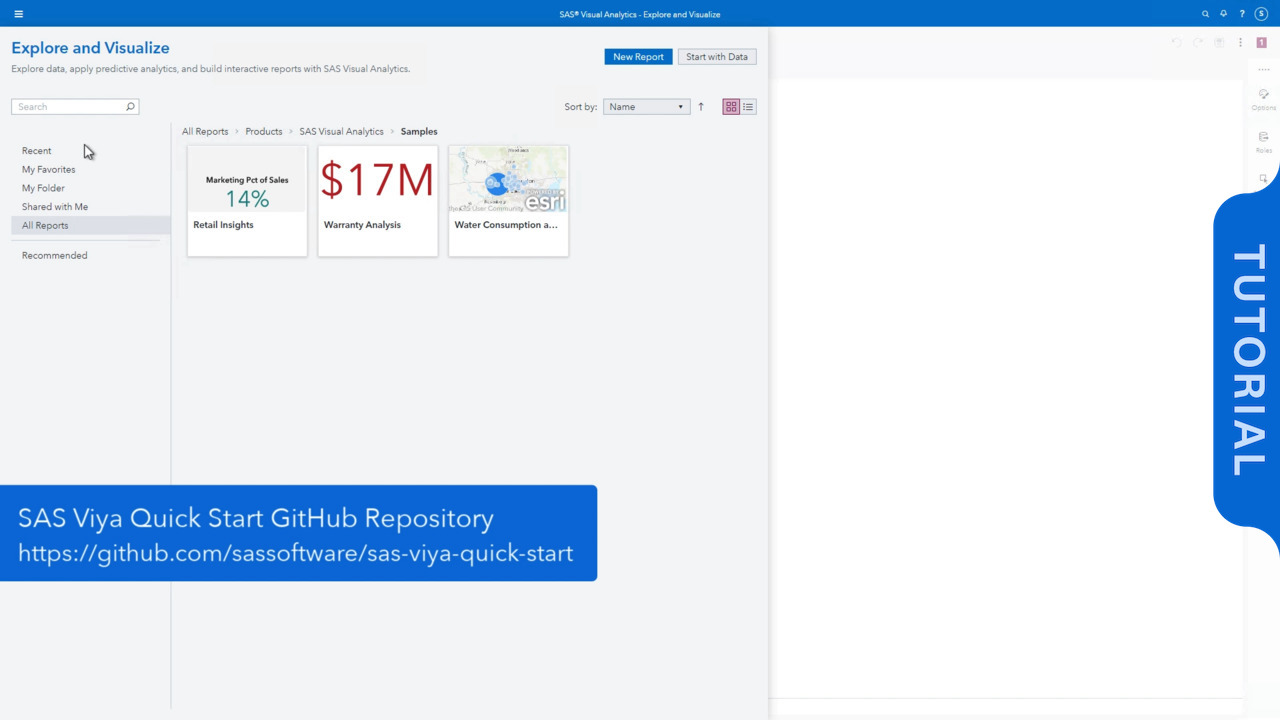
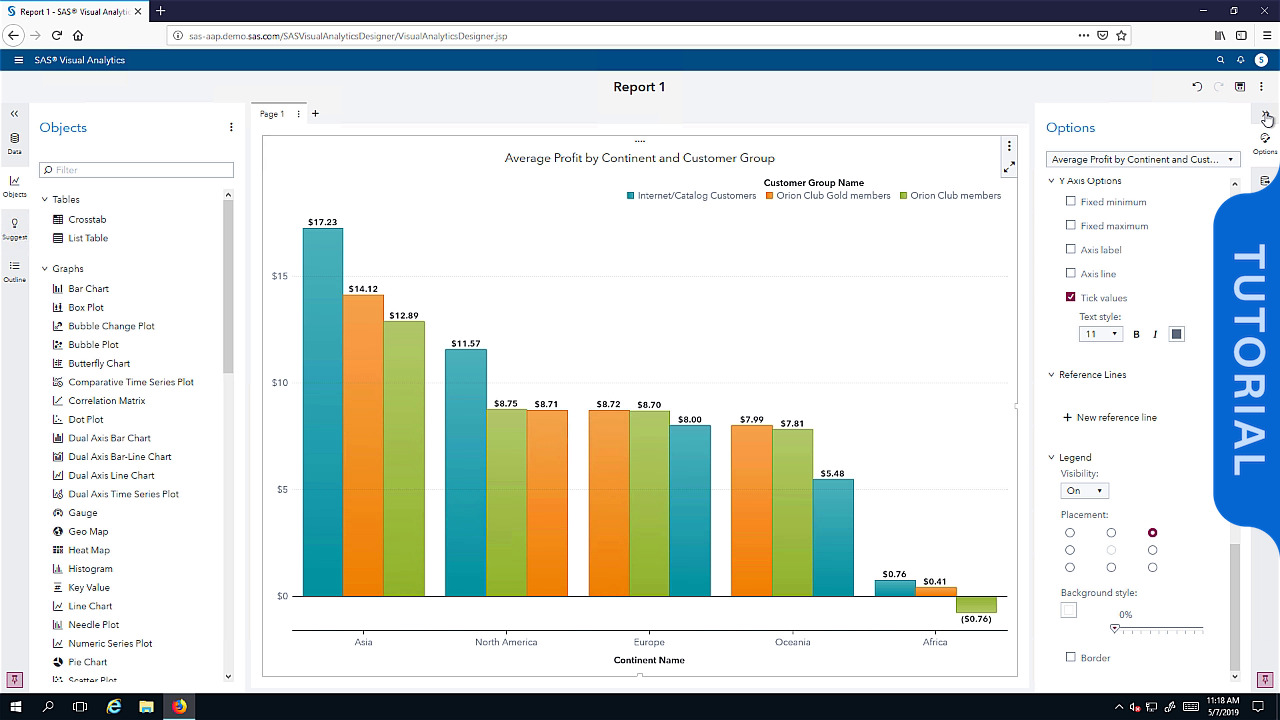
Creating a Basic Report in SAS Visual Analytics 7.5
This video demonstrates the steps to design a simple report in SAS Visual Analytics. We access data sources and modify data properties. We add a report object to the canvas, designate roles, and modify properties. Lastly, the report is saved.
categories
View more in
Currently loaded videos are 1 through 14 of 14 total videos.
First page loaded, no previous page available
Last page loaded, no next page available
Sort By:
Sort By:
Most Recent