Video Player is loading.
Skip to collection list
Skip to video grid
Trending
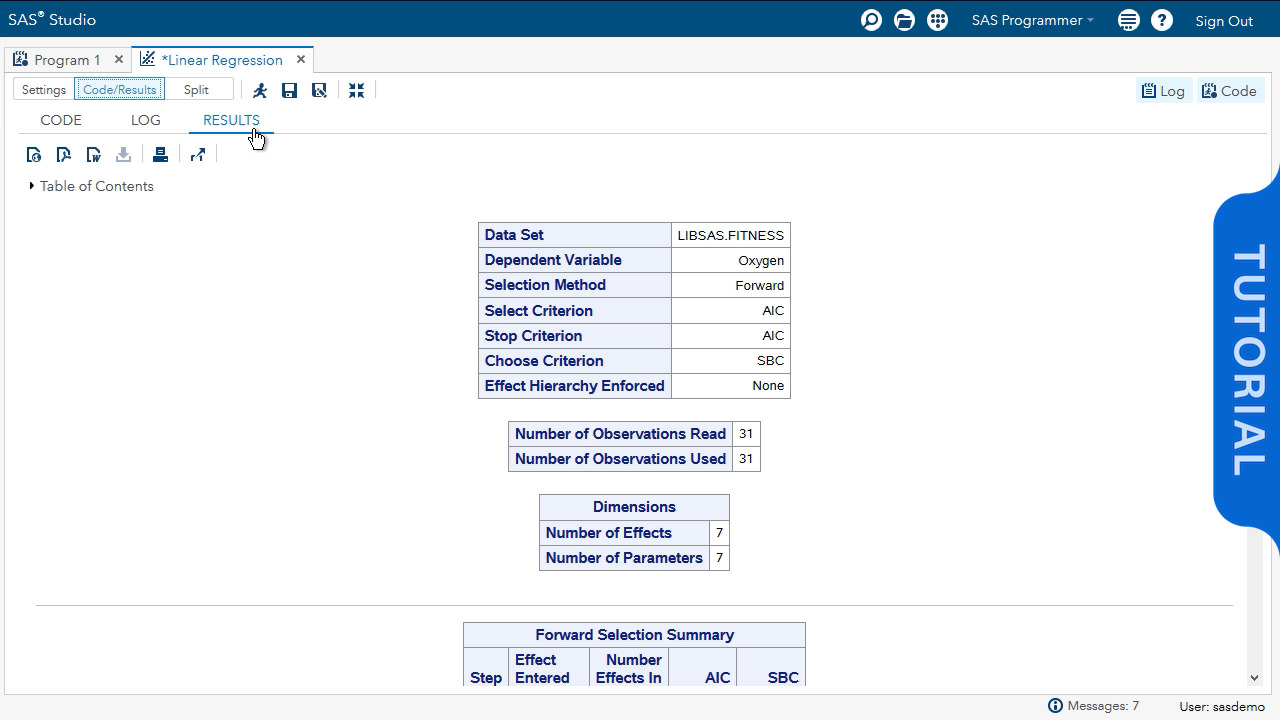
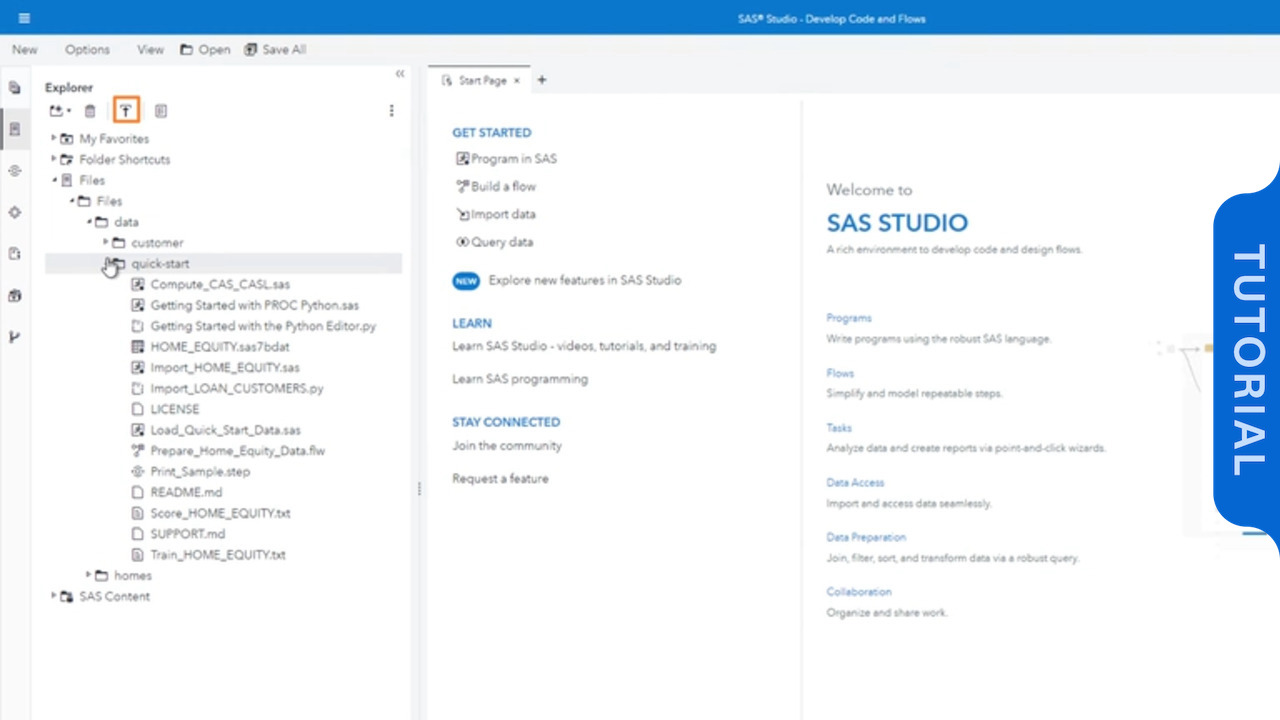
Use Python Code in SAS Studio
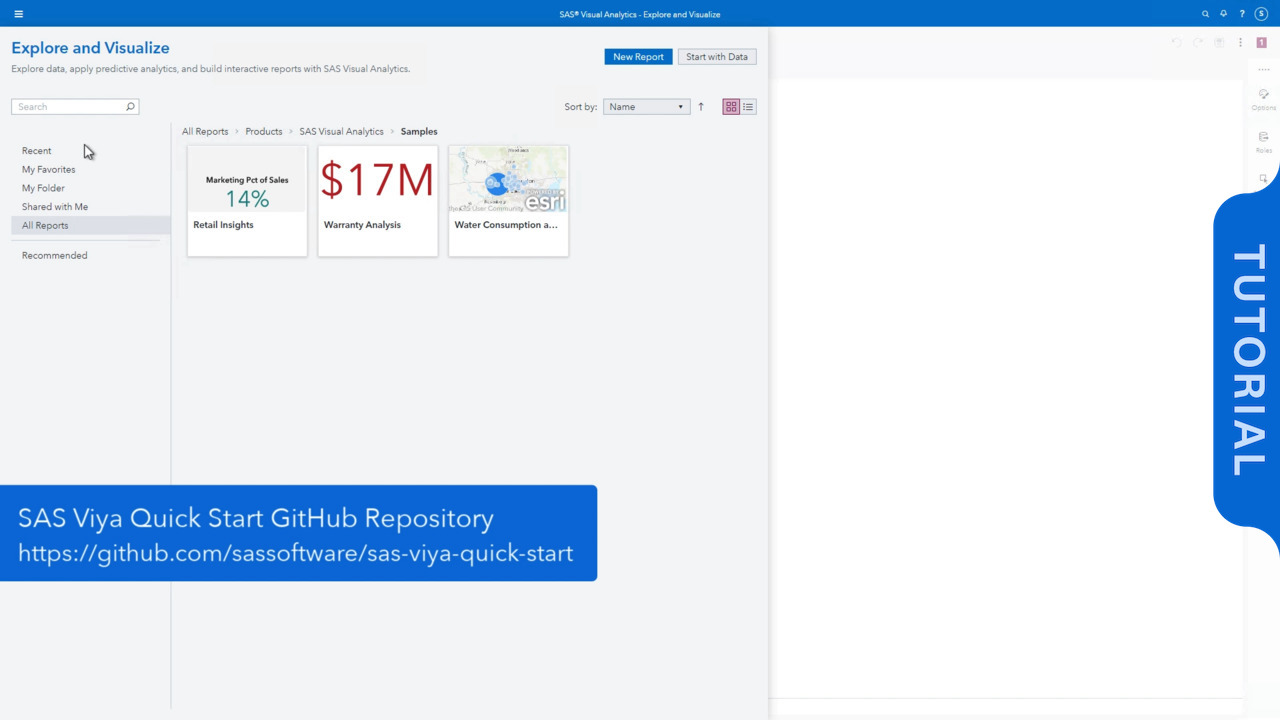
This Quick Start tutorial shows you how to easily execute Python code in SAS Studio on SAS Viya to access and prepare data. You also learn how to load data to Cloud Analytic Services (CAS) for further exploration in SAS Visual Analytics.
categories
View more in
Currently loaded videos are 1 through 14 of 14 total videos.
First page loaded, no previous page available
Last page loaded, no next page available
Sort By:
Sort By:
Most Recent