Skip to collection list
Skip to video grid
Trending
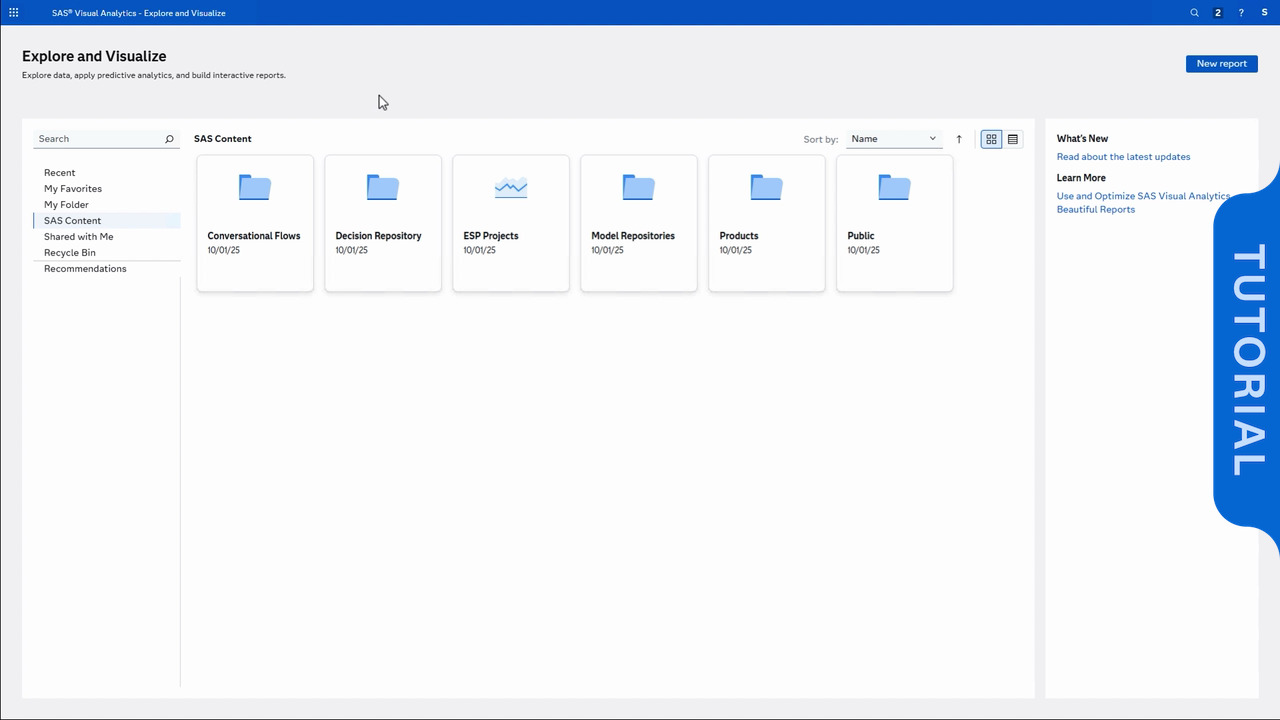
Creating Graphs by Using Explore Mode in SAS Visual Analytics on SAS Viya
In this video, we open a report, switch to Explore mode, add a second object in the same page, and exit explore mode. After we exit Explore mode, the new object is automatically added to a new hidden page, which can be displayed.
Read More
Read Less