Video Player is loading.
Skip to collection list
Skip to video grid
SAS Viya
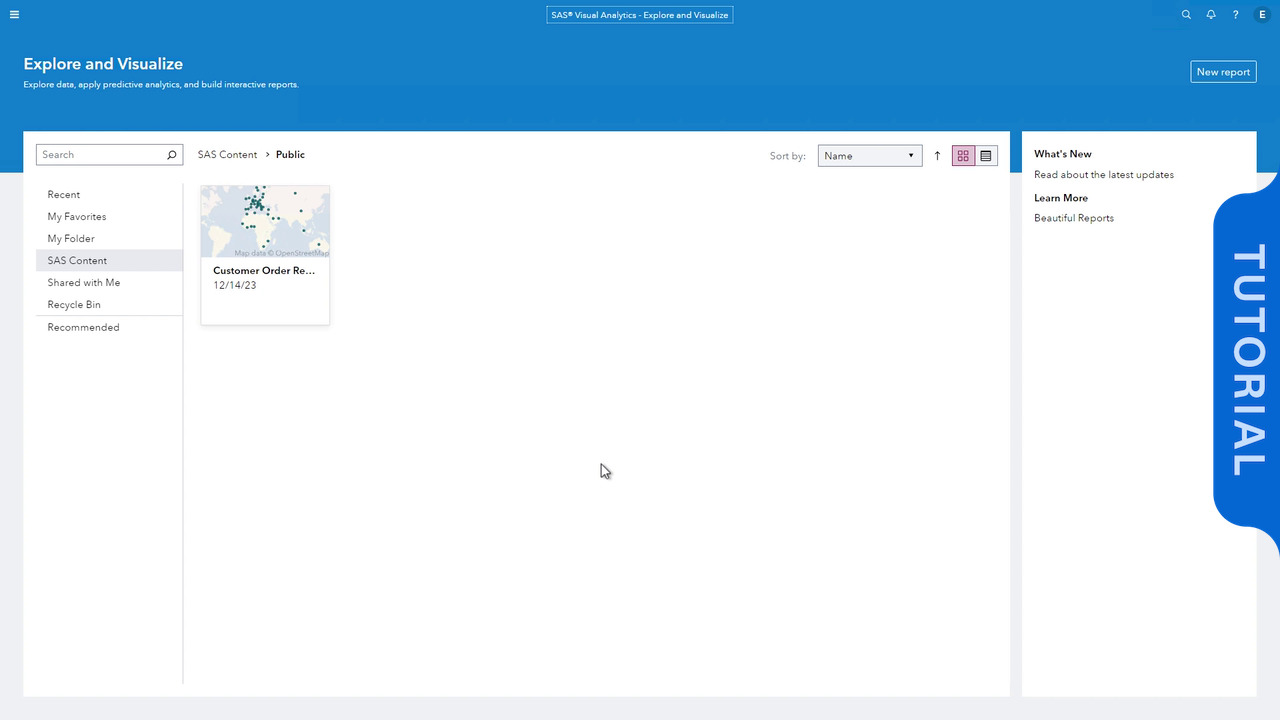
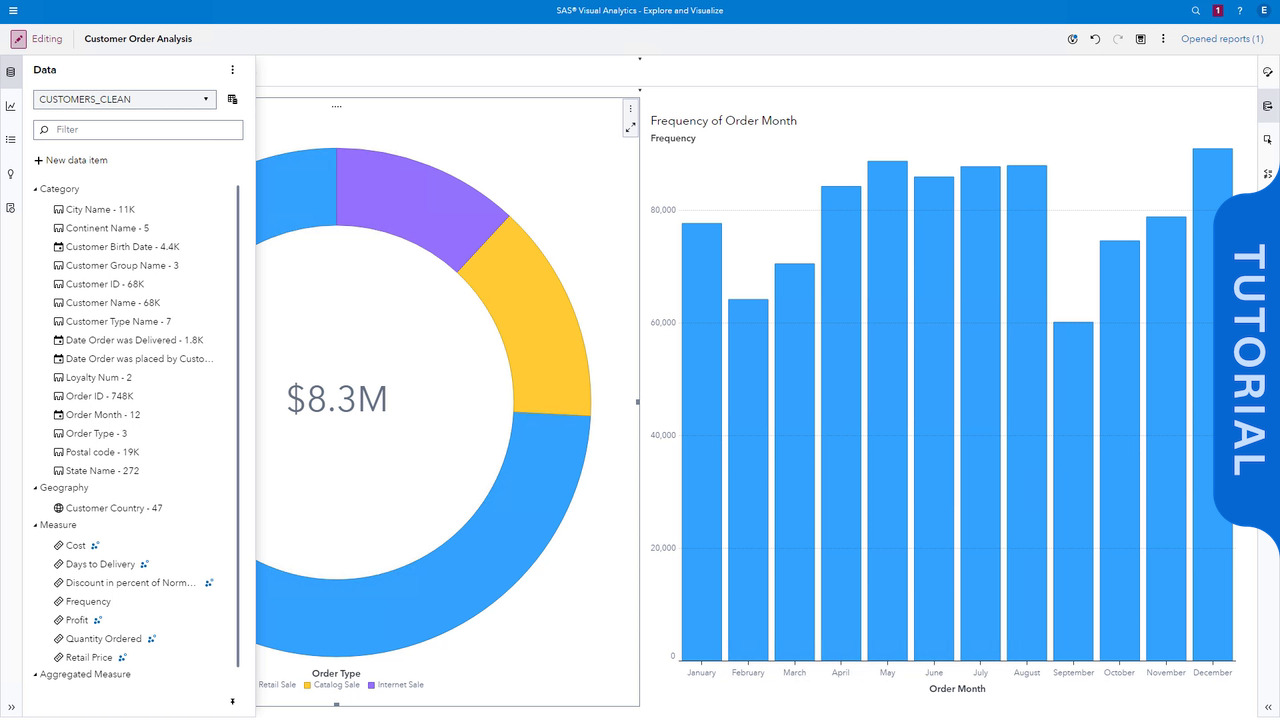
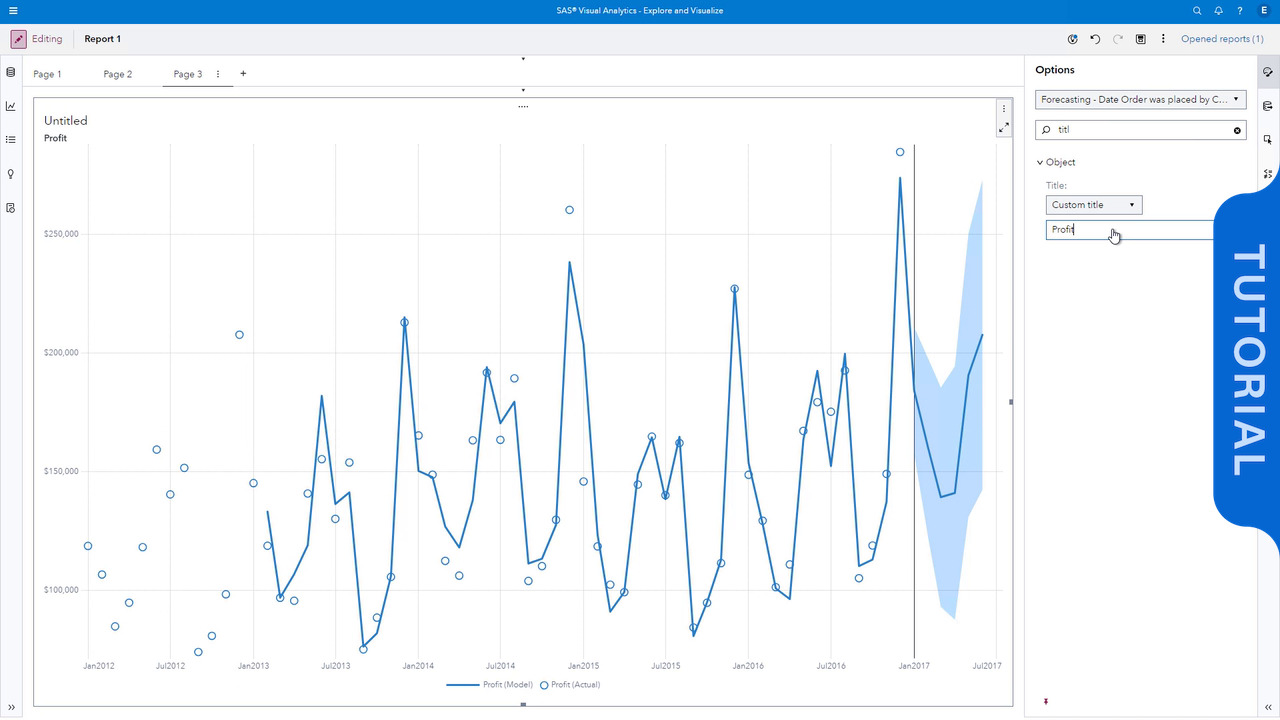
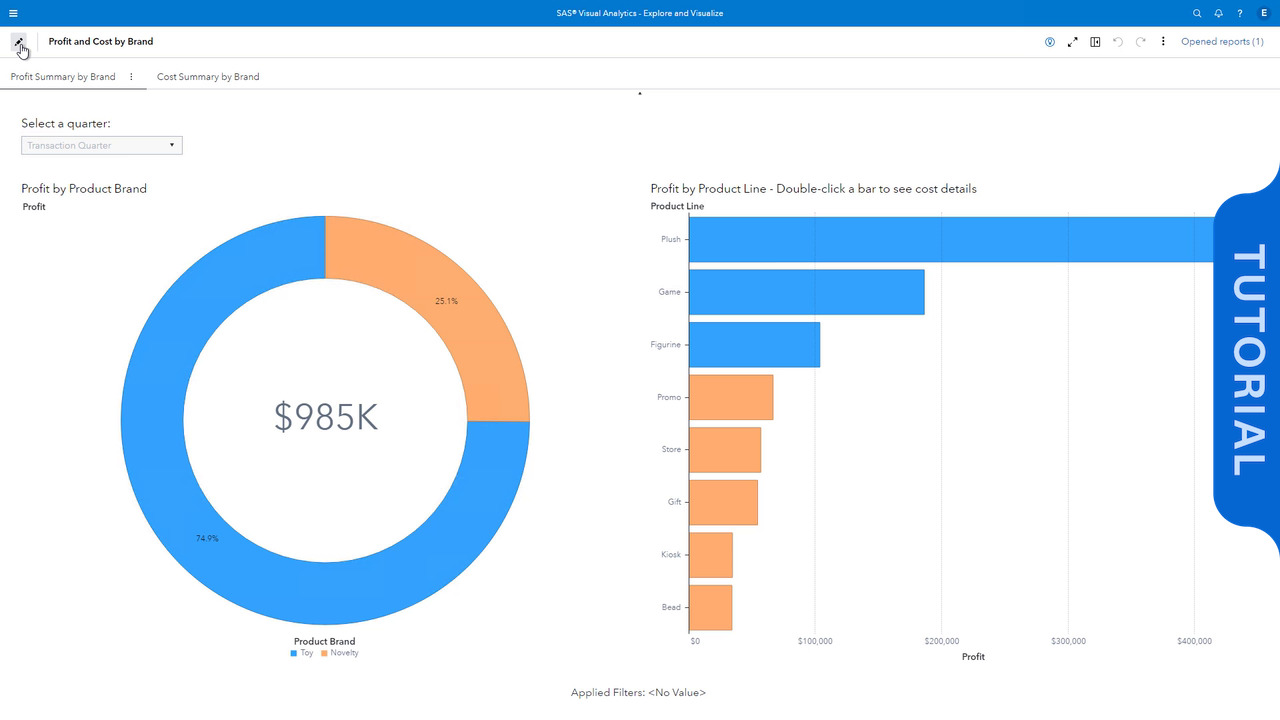
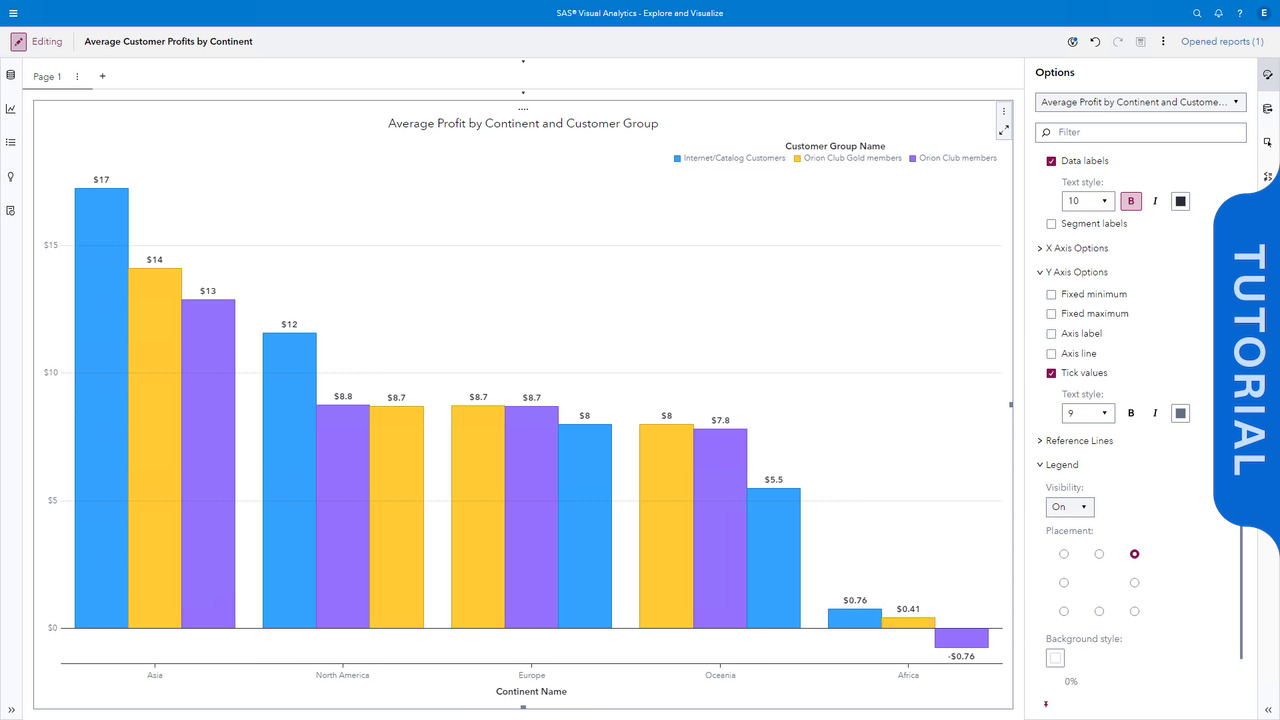
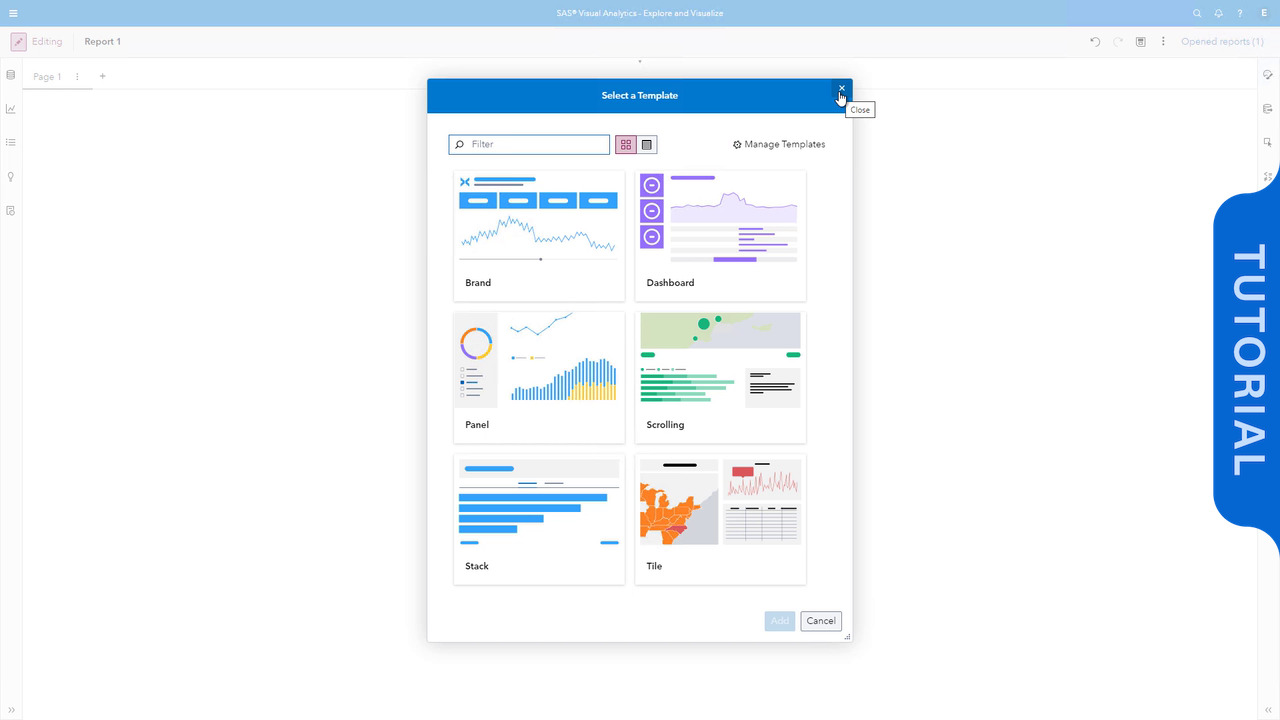
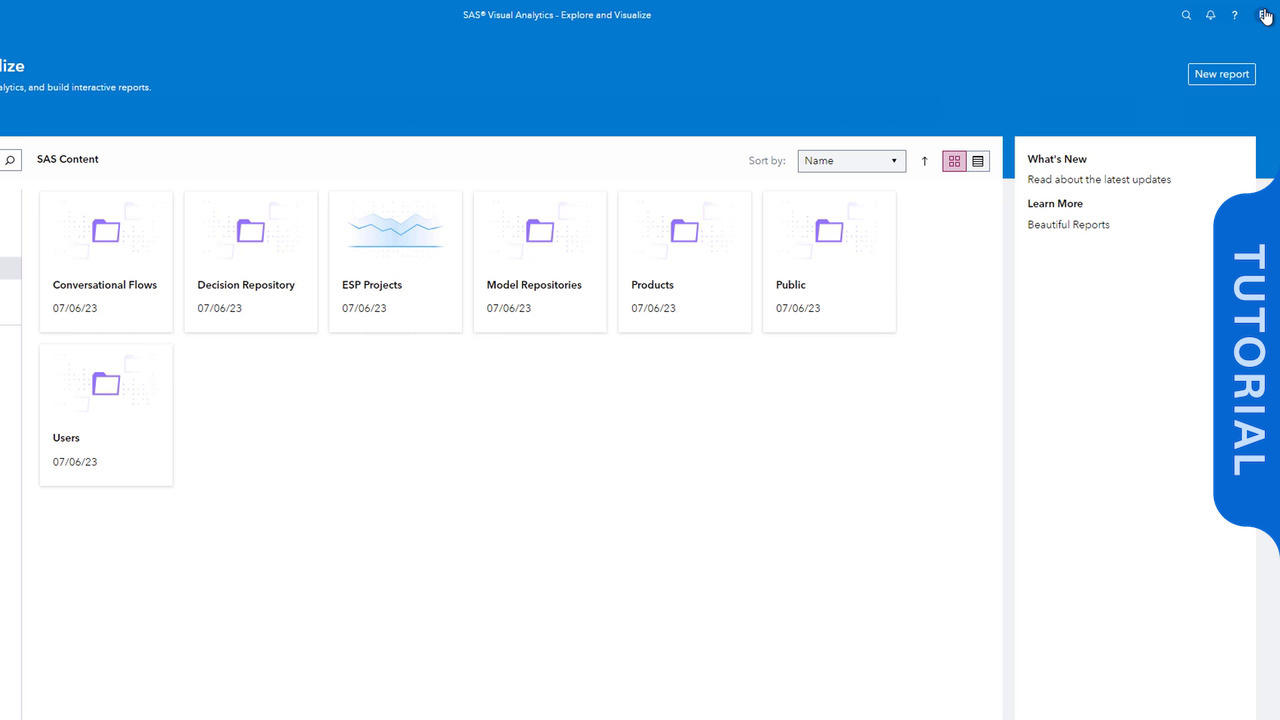
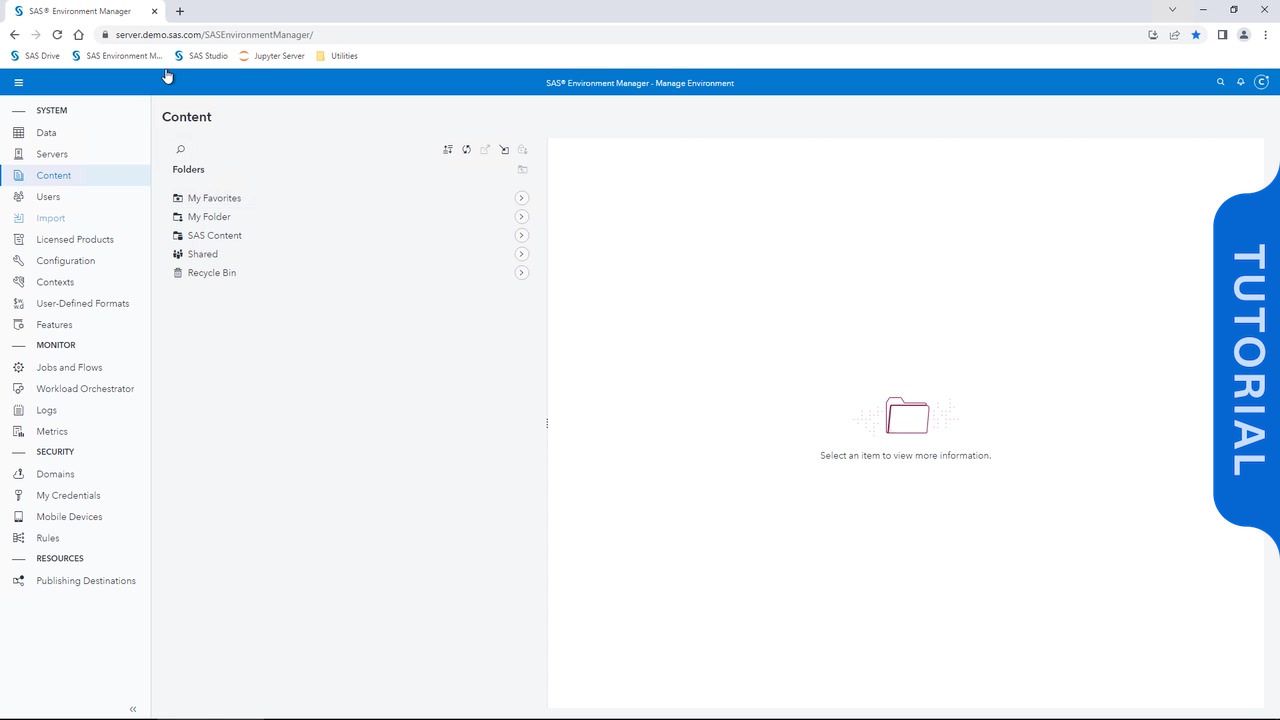
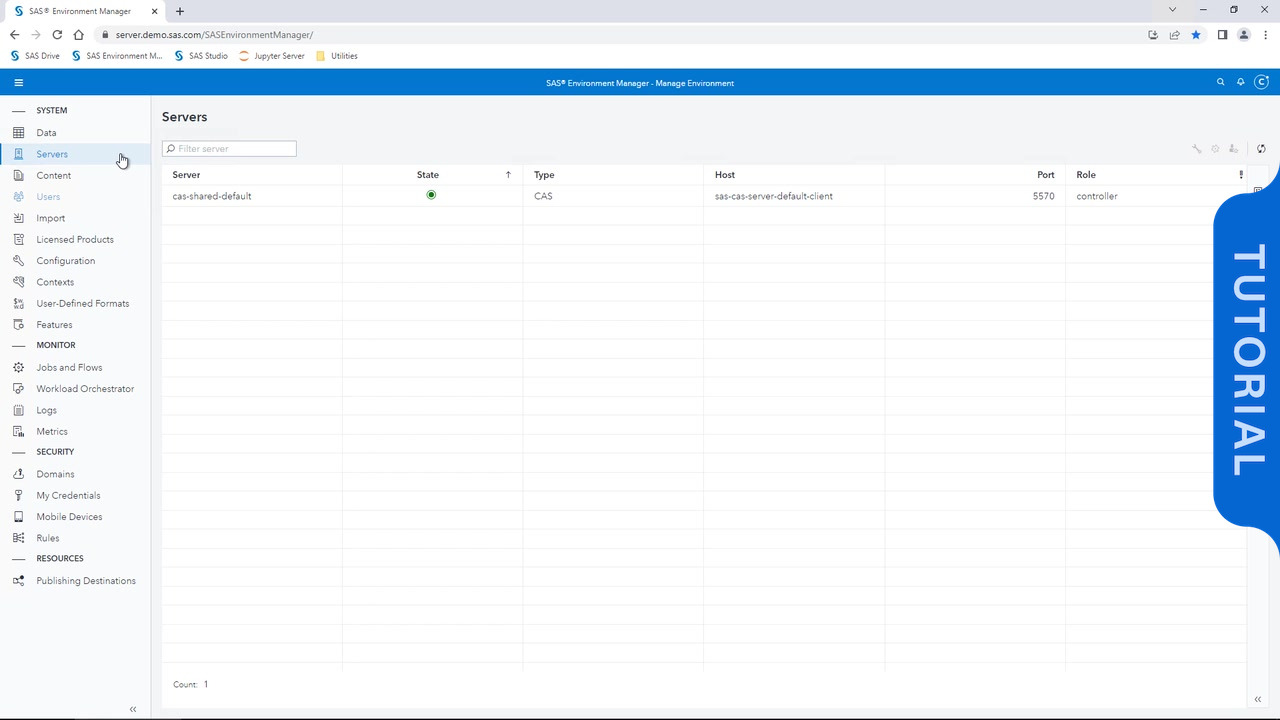
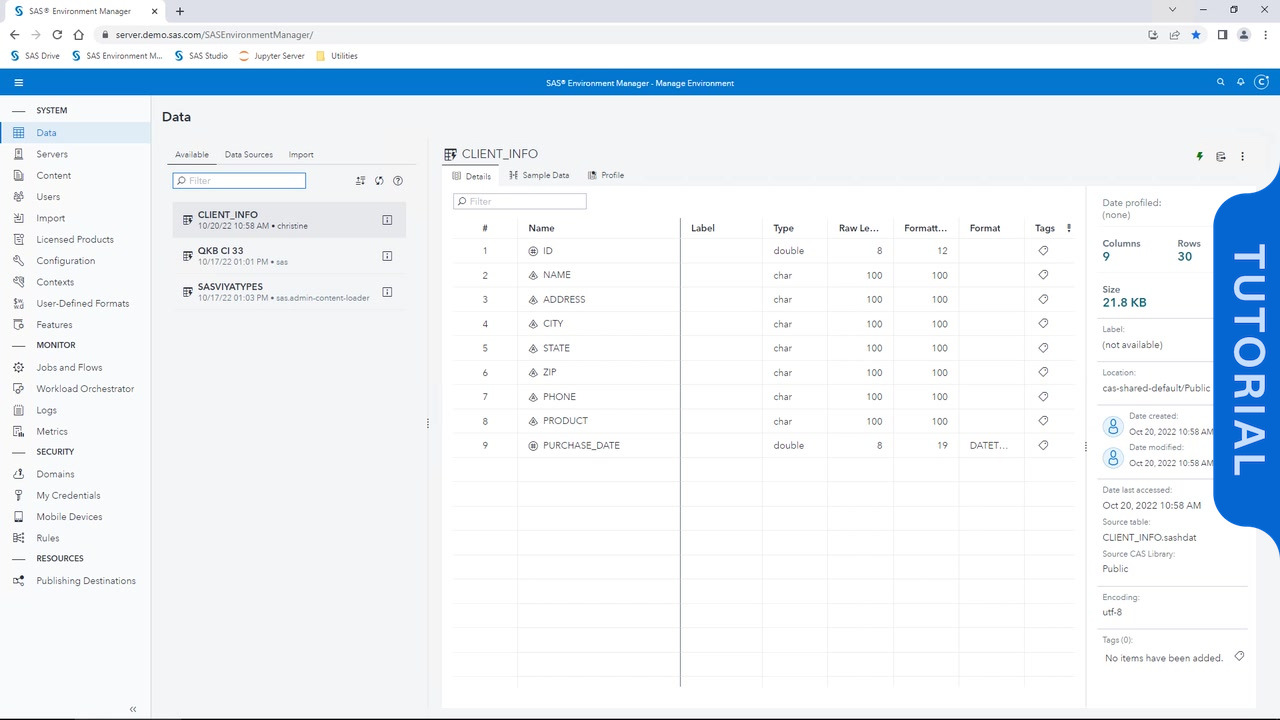
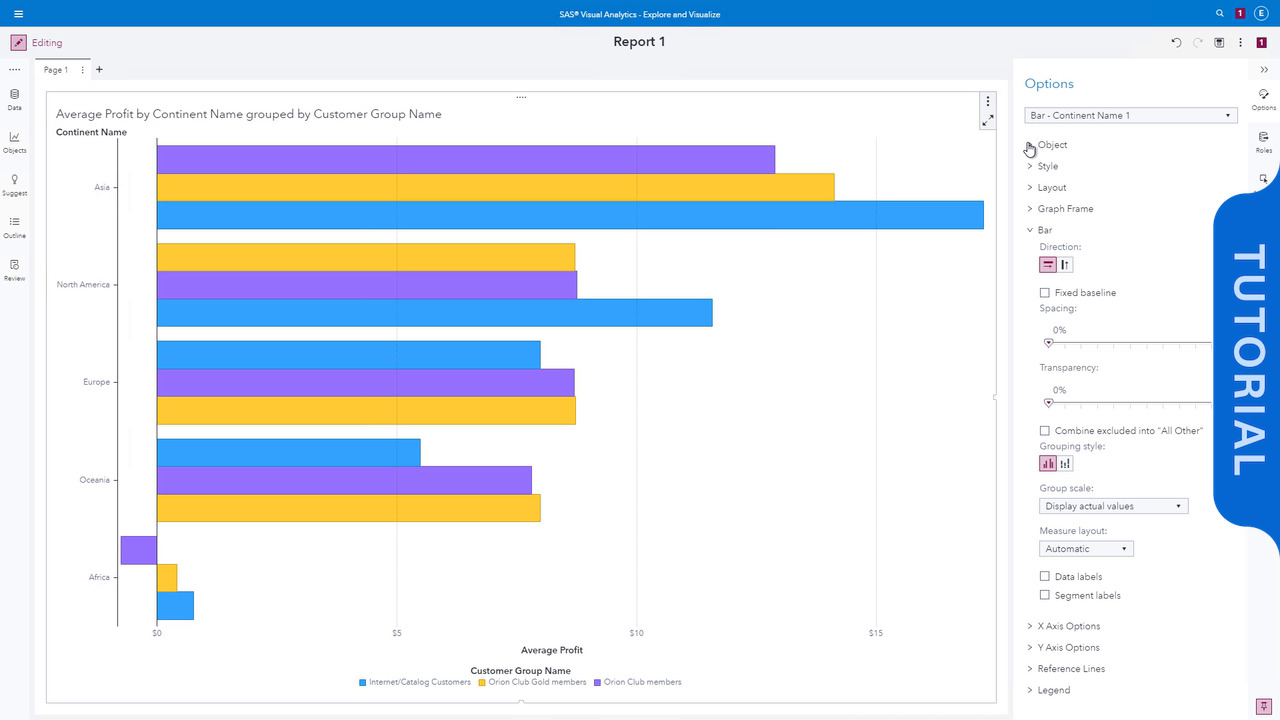
Creating a Basic Report in SAS Visual Analytics (Prior to 2023.06)
This video shows the steps to design a simple report in SAS Visual Analytics in SAS Viya. You see how to access data sources and modify data properties, as well as how to add a report object to the canvas, designate roles, and modify properties.
categories
- Trending
- Products & Solutions
- Analytics in Action
-
How To Tutorials
- SAS Viya Quick Start
- SAS Viya Workbench Quick Start
- SAS Add-In for Microsoft Office
- Administration & Architecture
- Advanced Analytics
- SAS Analytics U
- SAS Customer Intelligence 360
- SAS Customer Intelligence 6
- Data Management
- SAS Enterprise Guide
- SAS Enterprise Miner
- Fraud and Security Intelligence
- SAS Life Science Analytics Framework
- SAS Office Analytics
- Programming
- Risk Management
- SAS Studio on SAS 9
- SAS Studio on SAS Viya
- SAS Visual Analytics
- SAS Visual Data Mining and Machine Learning
- SAS Visual Statistics
-
SAS Viya
- Introducing SAS Viya
- Administration
- Statistical Procedures
- Data Management
- Data Mining and Machine Learning Procedures
- Model Studio
- SAS APIs for Other Languages
- SAS Econometrics
- SAS Forecasting
- SAS Intelligent Decisioning
- SAS Model Manager and SAS Decision Manager
- SAS Optimization
- SAS Visual Analytics | Prior to 2023.06
- SAS Visual Analytics | 2023.06 and later
- SAS Visual Data Mining and Machine Learning
- SAS Visual Investigator
- SAS Visual Statistics
- SAS Visual Text Analytics
- An Introduction to SAS Viya Programming for SAS 9 Programmers
- SAS Technical Insights & Expertise Series
View more in
Currently loaded videos are 1 through 15 of 184 total videos.
First page loaded, no previous page available
Load Next Page
Sort By:
Sort By:
Most Recent