Video Player is loading.
Skip to collection list
Skip to video grid
on SAS Viya
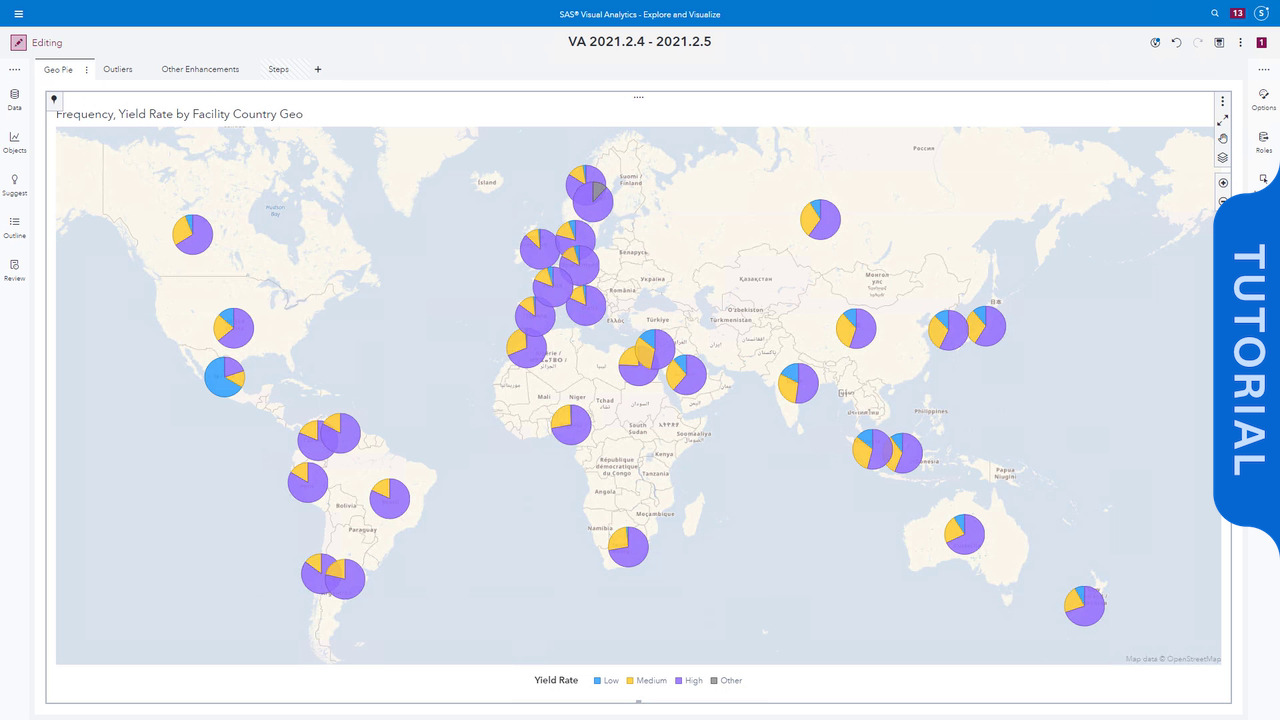
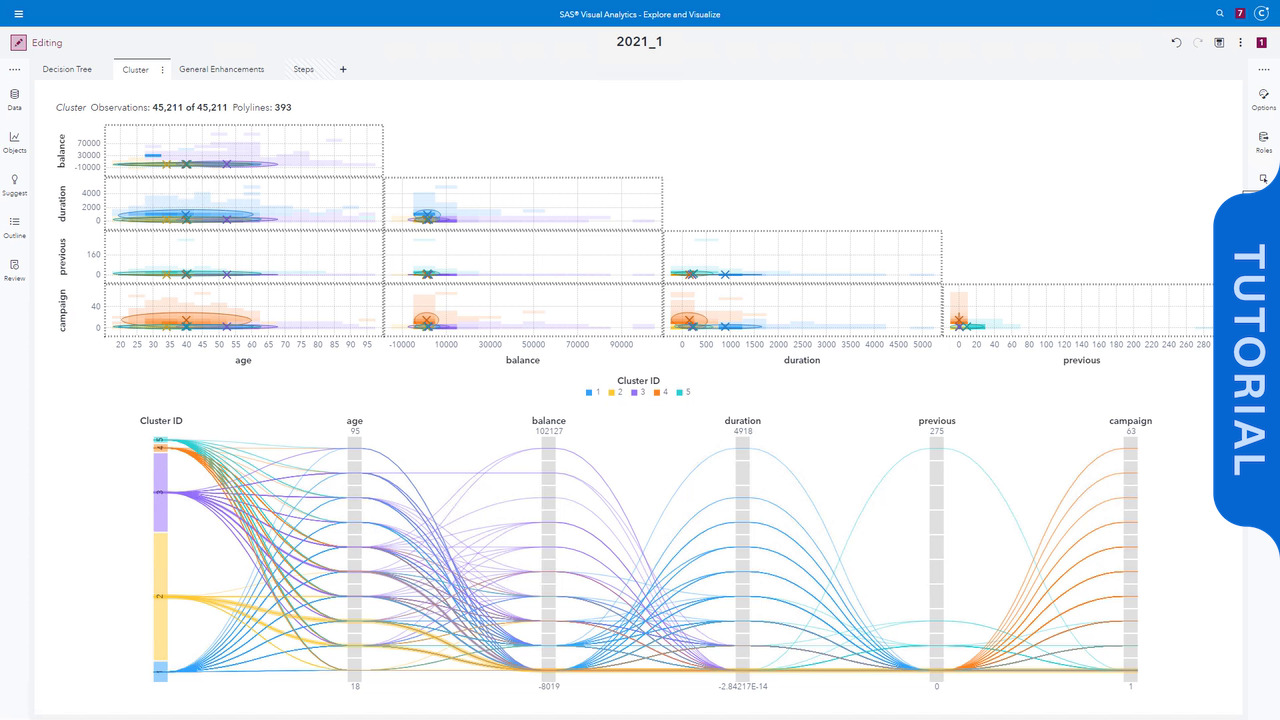
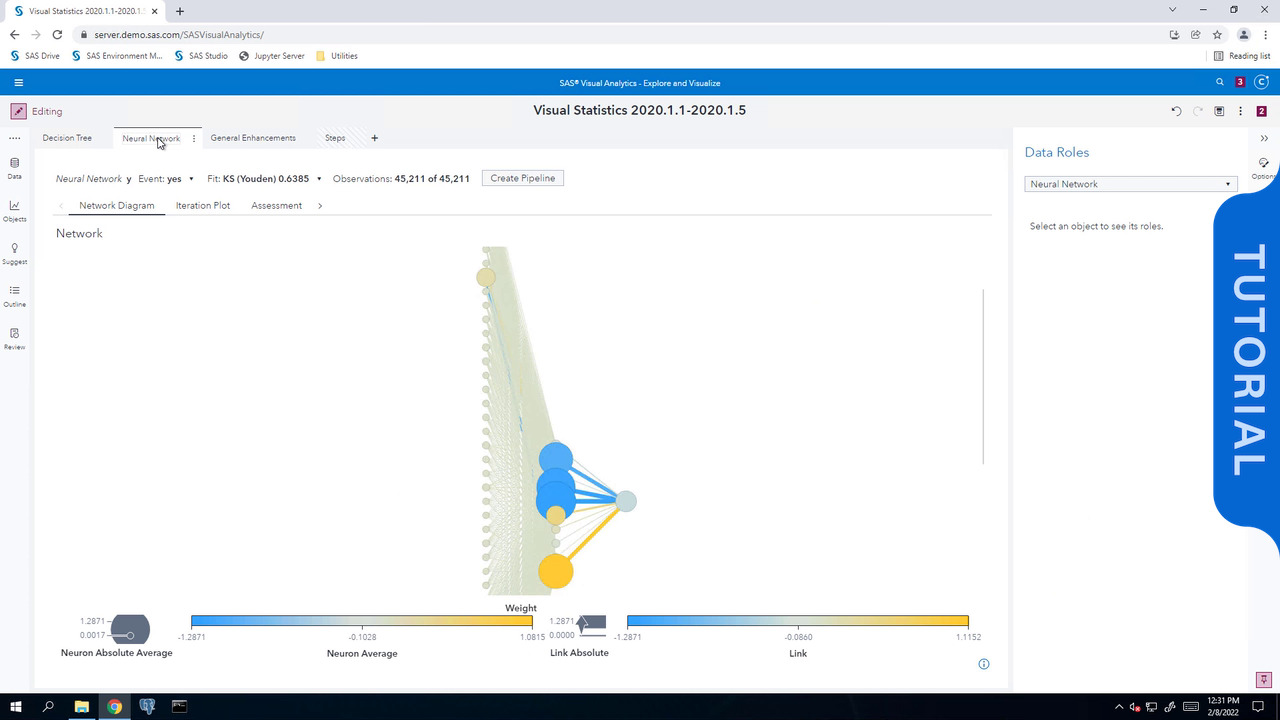
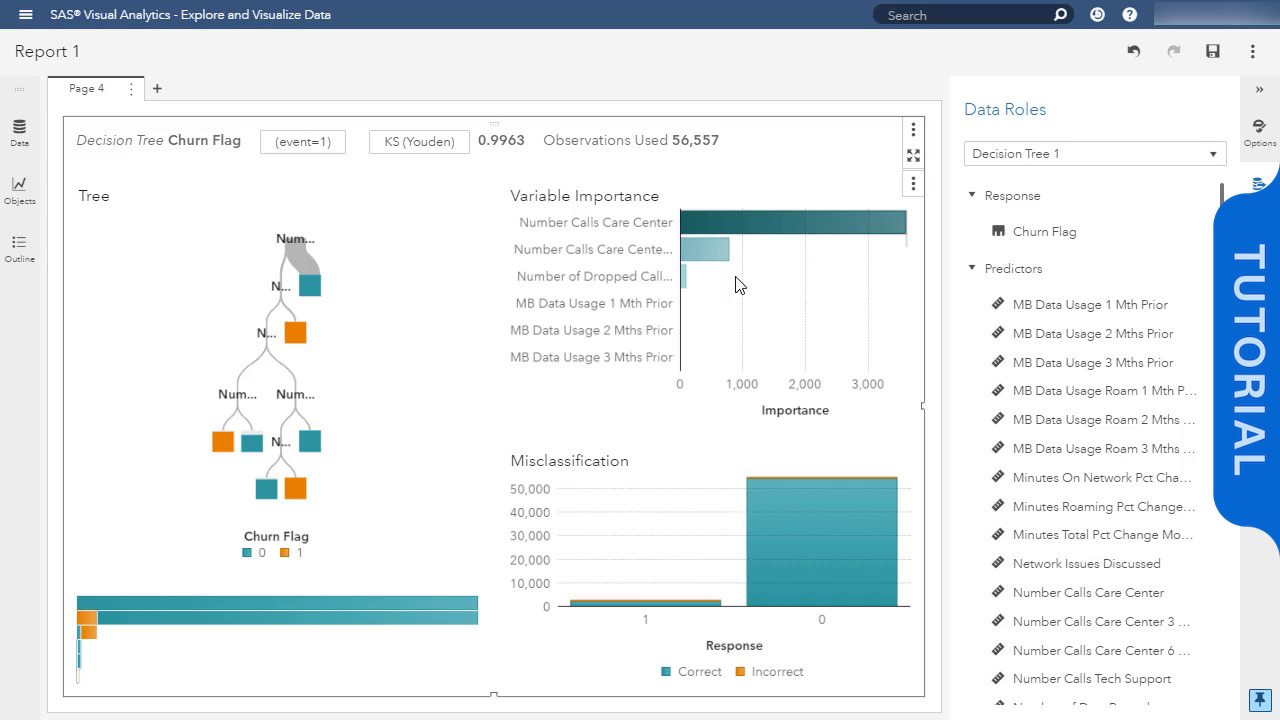
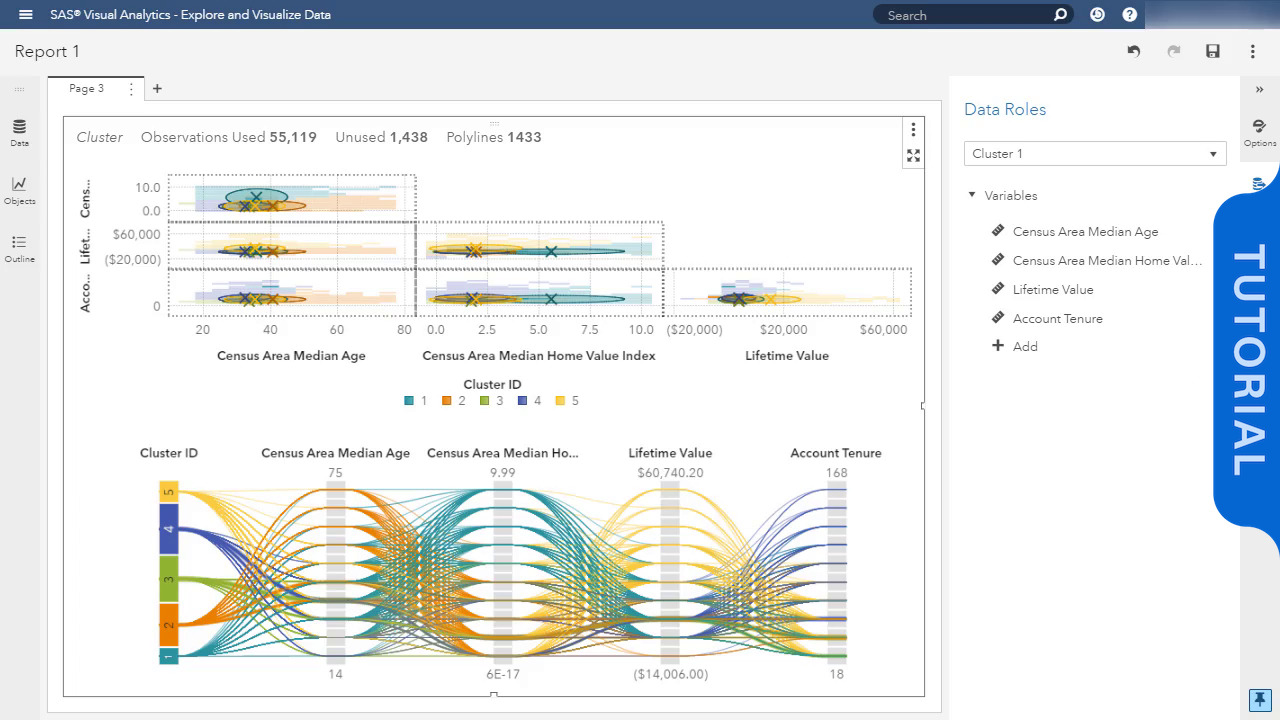
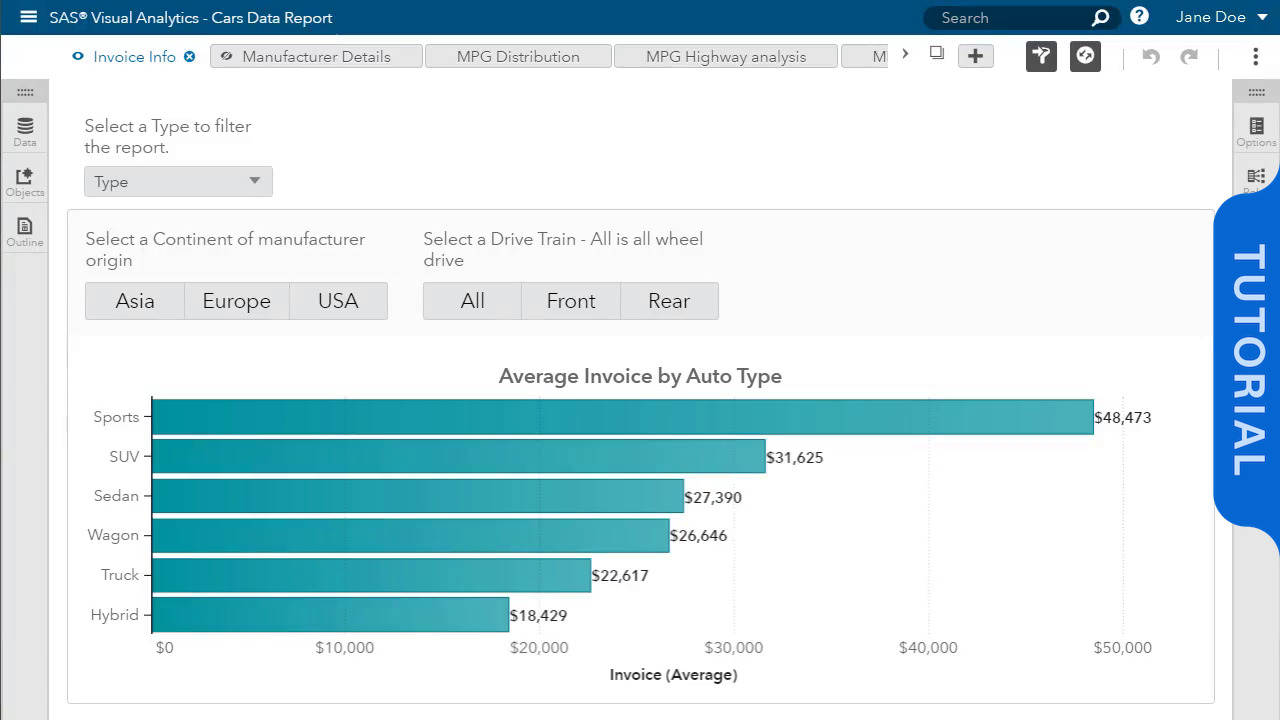
Comparing Graphs by Using Explore Mode in SAS Visual Analytics on SAS Viya
In this video, we open a multi-page report and switch to Explore mode. Using the outline section, we move graph objects to different pages for side-by-side comparison. When we exit Explore mode, all layout changes revert to the original appearance.
categories
- Trending
- Products & Solutions
- Analytics in Action
-
How To Tutorials
- SAS Viya Quick Start
- SAS Viya Workbench Quick Start
- SAS Add-In for Microsoft Office
- Administration & Architecture
- Advanced Analytics
- SAS Analytics U
- SAS Customer Intelligence 360
- SAS Customer Intelligence 6
- Data Management
- SAS Enterprise Guide
- SAS Enterprise Miner
- Fraud and Security Intelligence
- SAS Life Science Analytics Framework
- SAS Office Analytics
- Programming
- Risk Management
- SAS Studio on SAS 9
- SAS Studio on SAS Viya
- SAS Visual Analytics
- SAS Visual Data Mining and Machine Learning
- SAS Visual Statistics
- SAS Viya
- SAS Technical Insights & Expertise Series
View more in
Currently loaded videos are 1 through 15 of 15 total videos.
First page loaded, no previous page available
Last page loaded, no next page available
Sort By:
Sort By:
Most Recent