Video Player is loading.
Skip to collection list
Skip to video grid
Trending
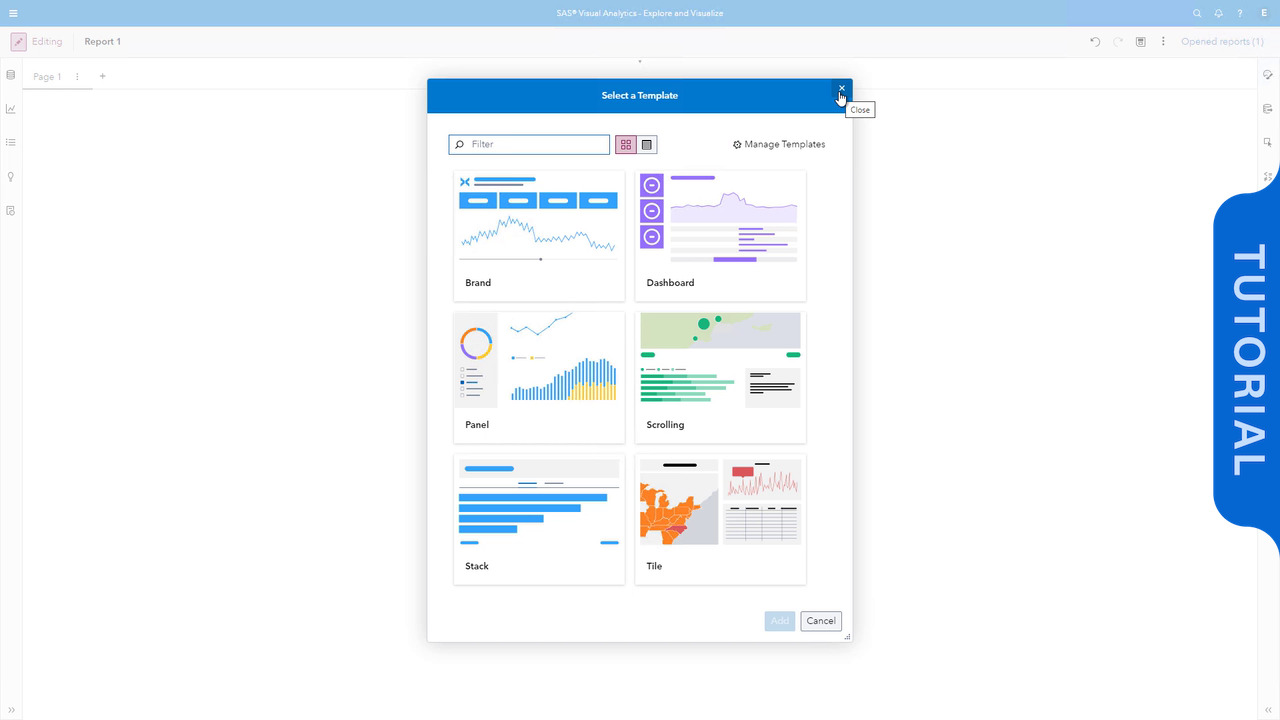
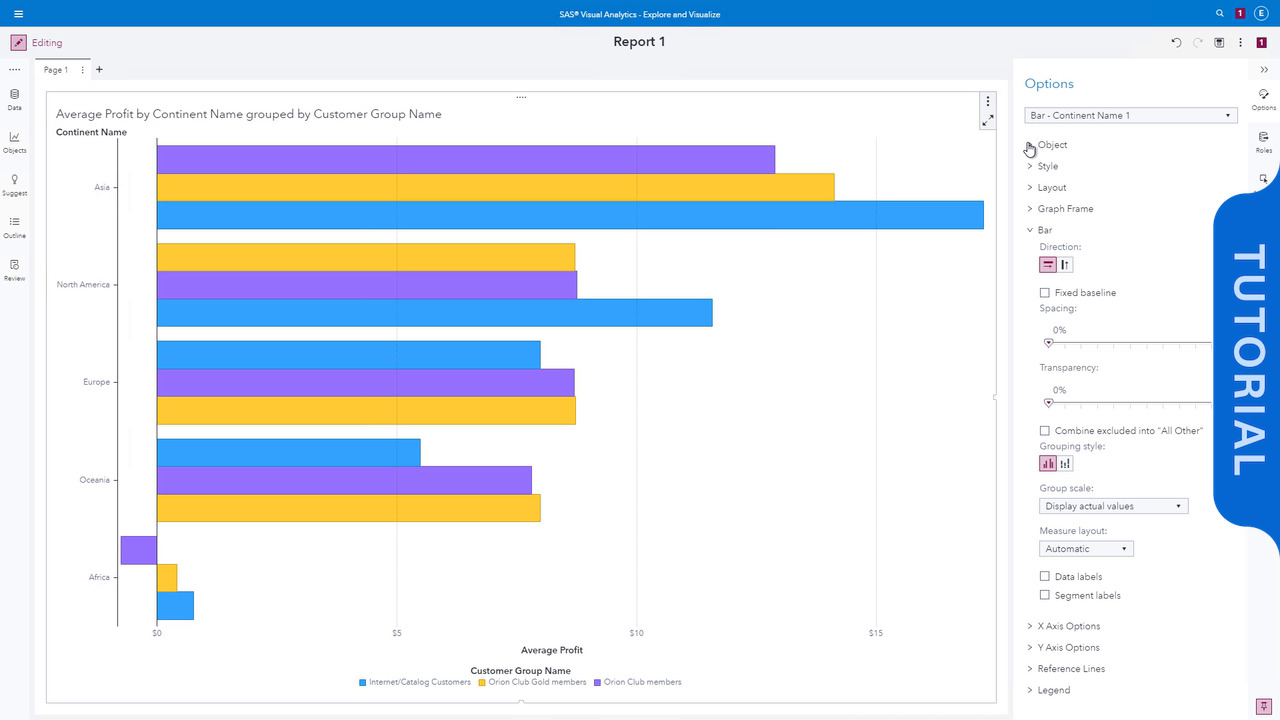
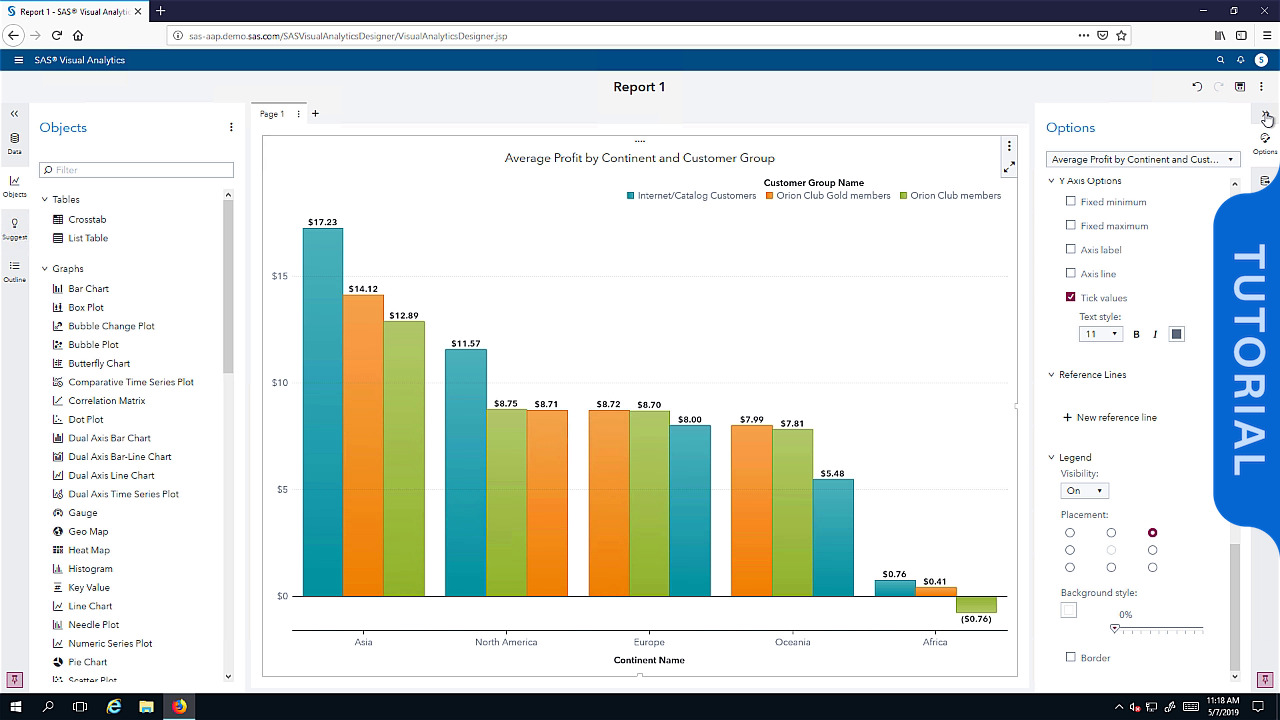
Creating a Basic Report in SAS Visual Analytics 7.5
This video demonstrates the steps to design a simple report in SAS Visual Analytics. We access data sources and modify data properties. We add a report object to the canvas, designate roles, and modify properties. Lastly, the report is saved.
categories
Search results
Your search for data step produced 28 results
28 results
data step
Currently loaded videos are 1 through 15 of 28 total videos.
First page loaded, no previous page available
Load Next Page
Sort By:
Sort By:
Most Recent